Foreword
This study begins with a simple observation from daily practice: between the moment a company delivers and the moment it sees its money, there is a gap. How large that gap is for the Austrian economy as a whole, nobody has so far been able to say precisely. Since the annual accounts held by the commercial register became machine-readable open data, it can be measured for the first time, not with a survey, but with the balance sheets themselves.
"195 billion euros are not a footnote in the bookkeeping, they are the largest silent credit market in the country. Austrian companies finance each other to the tune of 38 percent of GDP, mostly involuntarily and mostly without interest. Whoever delivers is their customer's bank, whether they want to be or not." Dr Maximilian Kindler, author, founder and managing director of incaseof.law
"We did not ask, we counted: 149,916 annual accounts, every figure reproducible. What surprised us most was the concentration: one percent of companies holds 61 percent of the tied-up capital, while among the smallest, more than every fourth balance sheet stands without an equity buffer." Stephan Holzbach, MSc, co-author and CMO of incaseof.law
The ambition of this study is deliberately sober: no estimates, no dramatising language, every external figure checked against the original source, every figure of our own reproducible from the published analysis code. Where the data are silent, the study is silent too, and says so openly. Precisely for that reason, we are convinced, the results hold: they show a corporate landscape that is waiting for its money, and they show where that waiting becomes a risk.
Vienna, July 2026
Dr Maximilian Kindler and Stephan Holzbach, MSc
Executive summary
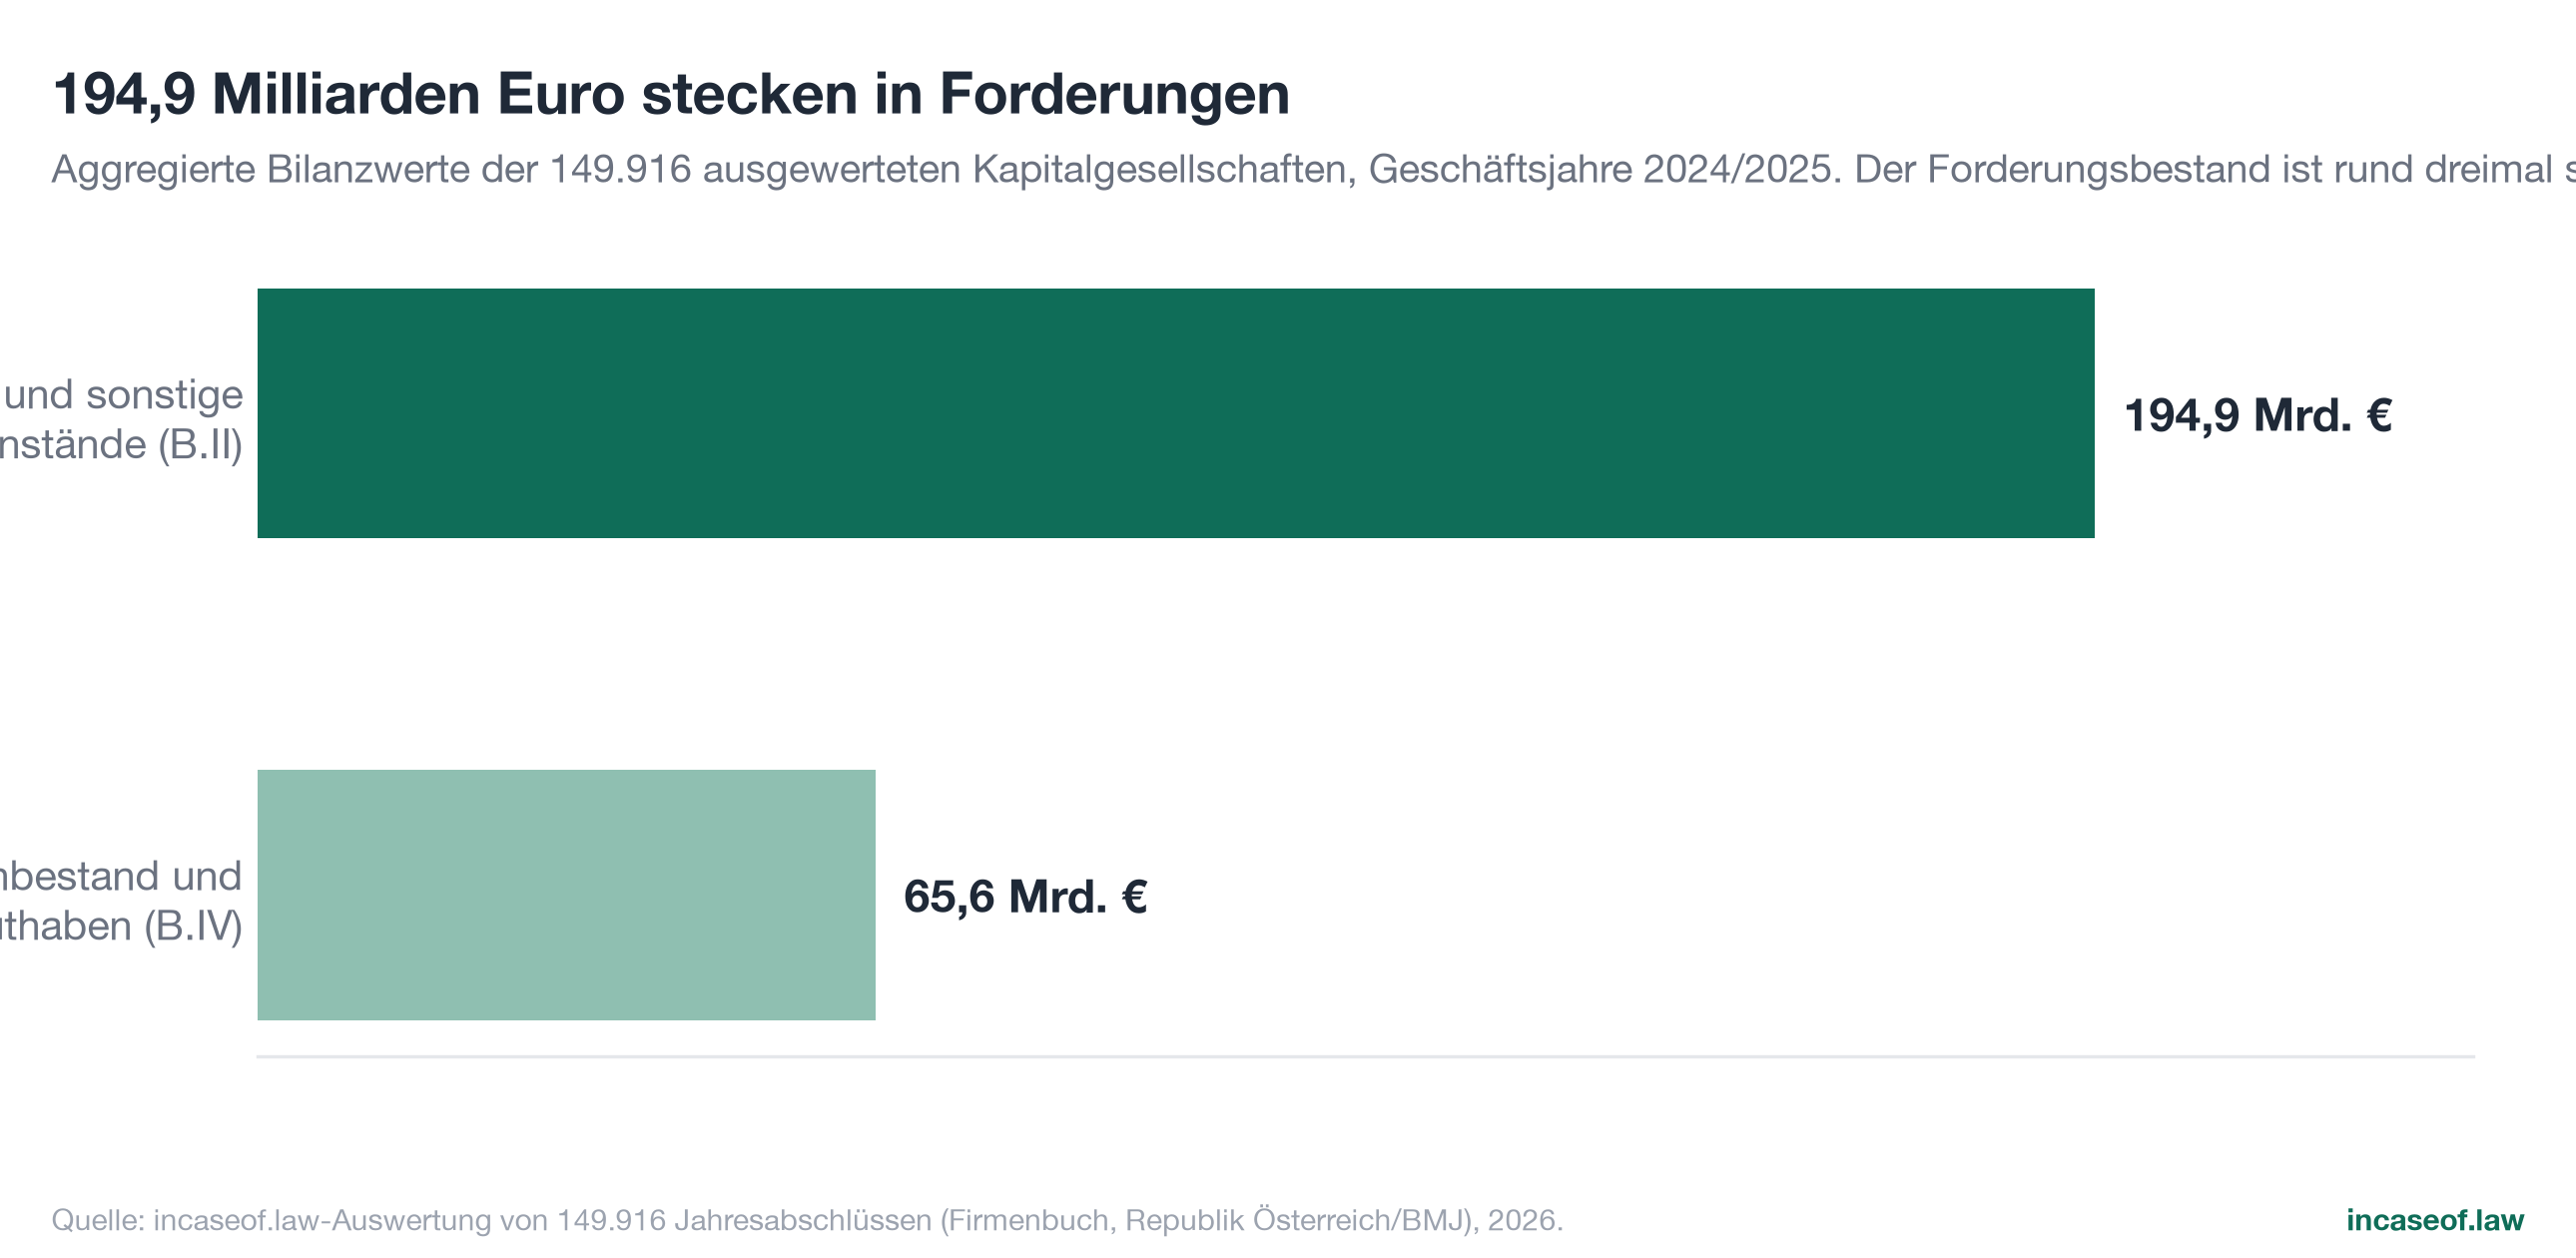
Austrian companies finance each other to a considerable extent: at their respective most recent balance sheet dates in the financial years 2024 and 2025, the 149,916 limited companies analysed report a combined 194.9 billion euros in the balance sheet item "receivables and other assets" (item B.II under Section 224 UGB, the Austrian Commercial Code). That corresponds to 38 percent of Austrian gross domestic product of 512.8 billion euros in 2025 (Statistik Austria, 2026) and to roughly three times the liquid funds the same companies hold in cash and bank balances (65.6 billion euros). Every fifth euro of the aggregate balance sheet total of 951.8 billion euros is therefore tied up in receivables.
This study presents the first complete, register-based measurement of that receivables landscape. The basis is neither a sample nor a survey, but the machine analysis of all electronically filed annual accounts of Austrian limited companies through the open data interface of the commercial register under the Austrian Act on the Re-use of Public Sector Information (register data: Republic of Austria, represented by the Federal Ministry of Justice). Six findings shape the picture:
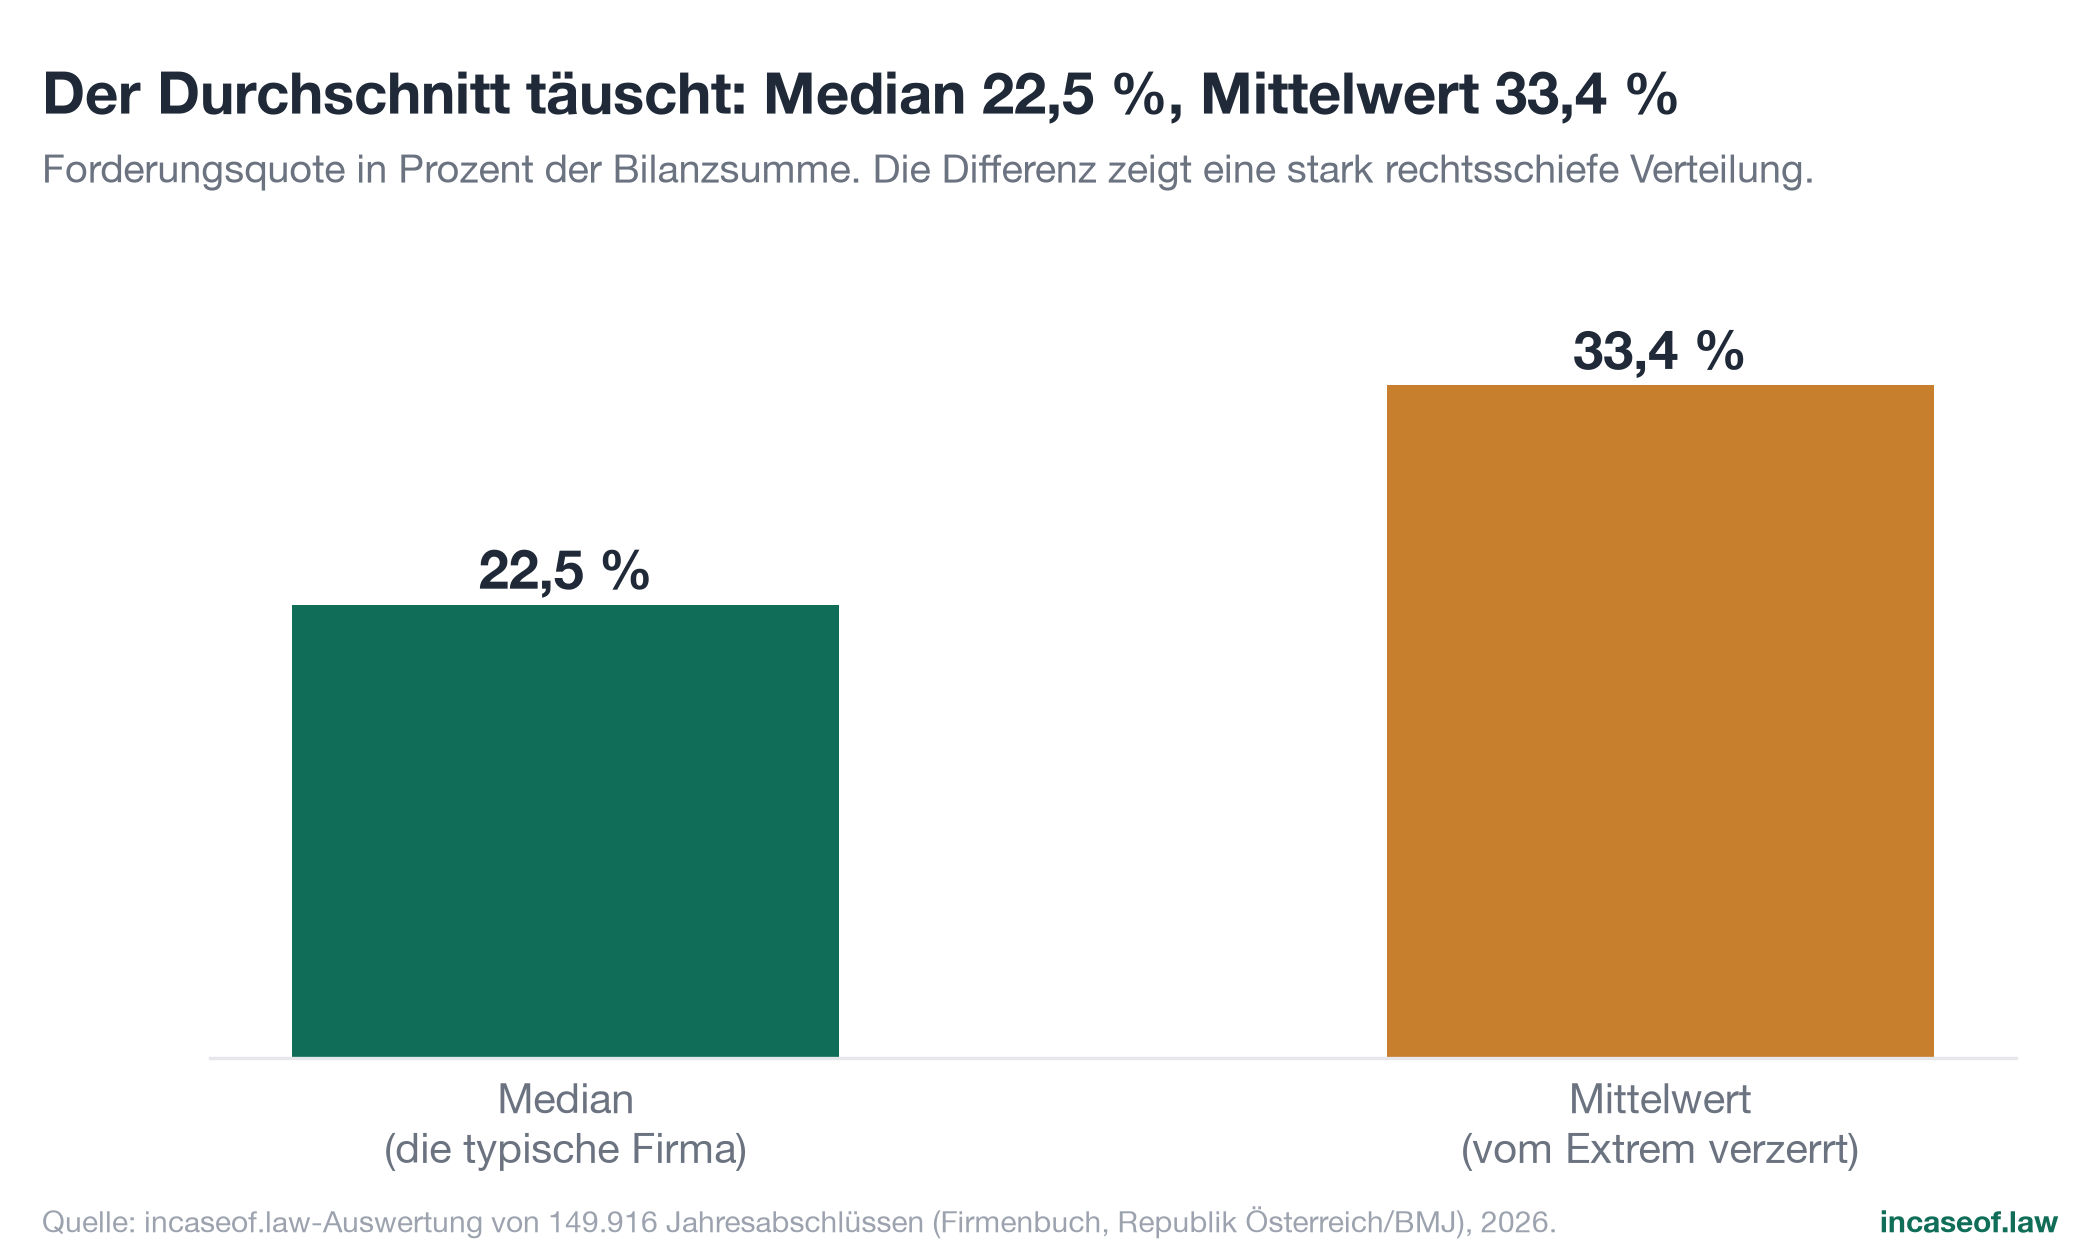
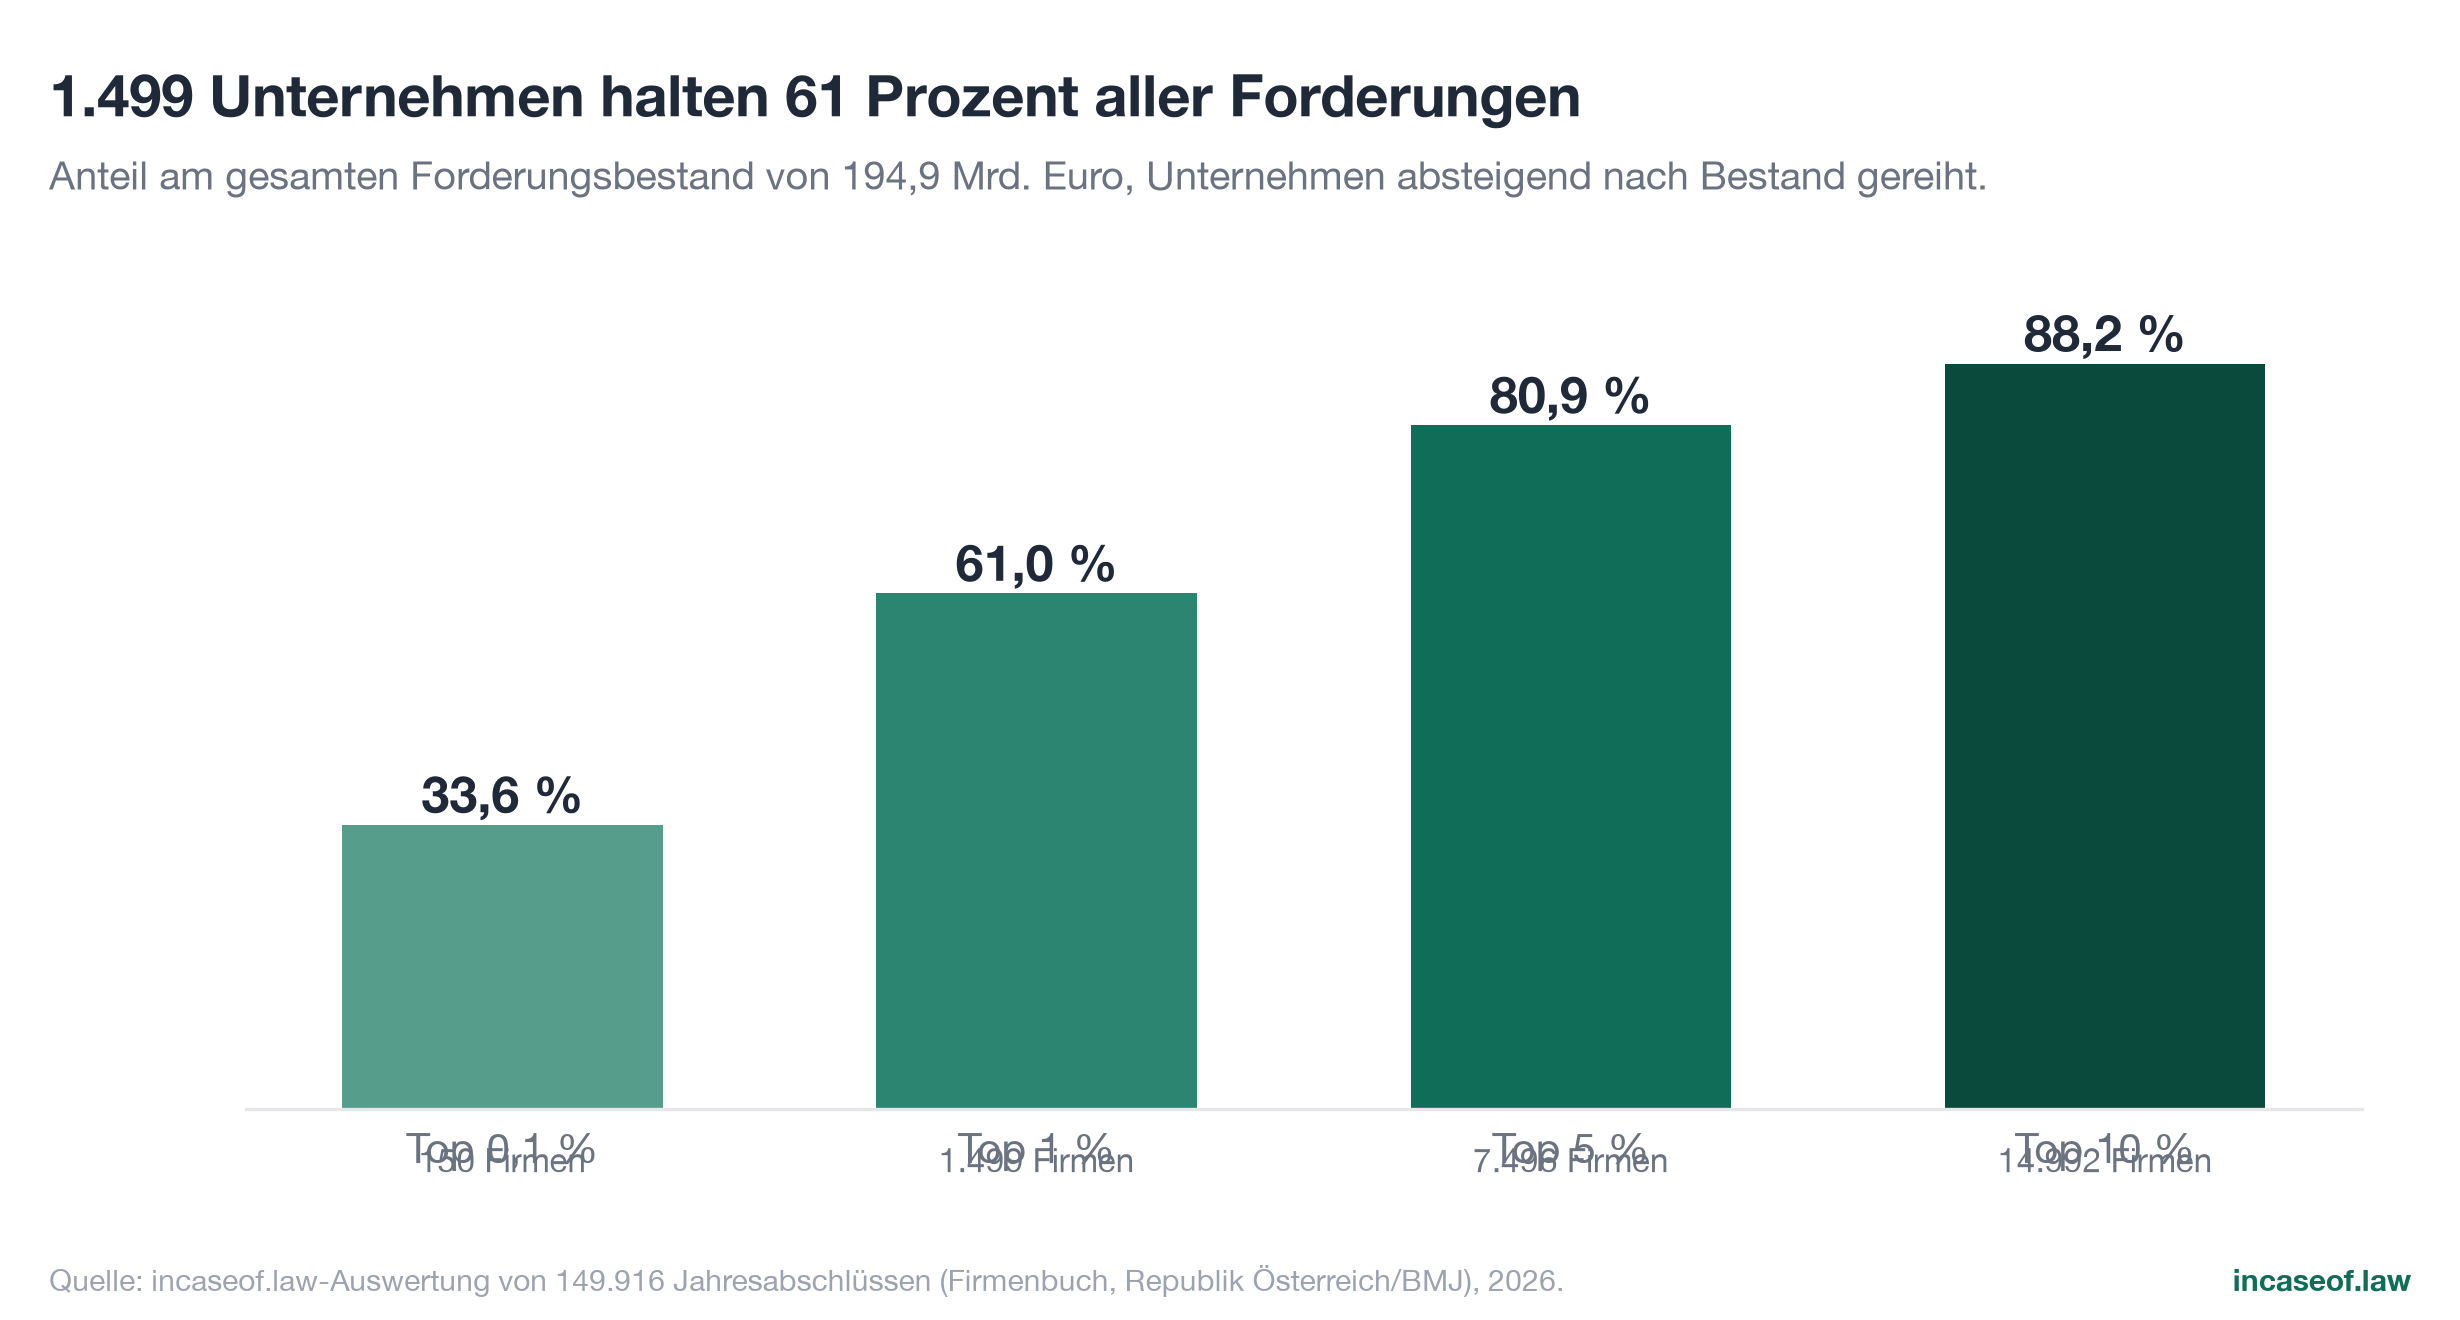
First: capital commitment is broad, but extremely unequally distributed. The median receivables ratio is 22.5 percent of total assets, the mean 33.4 percent. Behind this difference lies a strongly right-skewed distribution: one third of companies (34.0 percent) hold receivables of less than 10 percent of total assets, while for 13.8 percent of companies more than 80 percent of the balance sheet consists of receivables and other assets. The volume is concentrated in few hands: the top one percent of companies (1,499 entities) holds 61.0 percent of the entire stock of receivables, the top ten percent hold 88.2 percent. The Gini coefficient of the receivables distribution is 0.92.
Second: a heavy receivables burden frequently meets weak buffers. 32,437 companies (21.6 percent) report negative equity; among micro entities this affects 27.9 percent. 9,139 companies combine negative equity with a receivables ratio above 50 percent of total assets: for them, the most important block of assets is at the same time the least certain one.
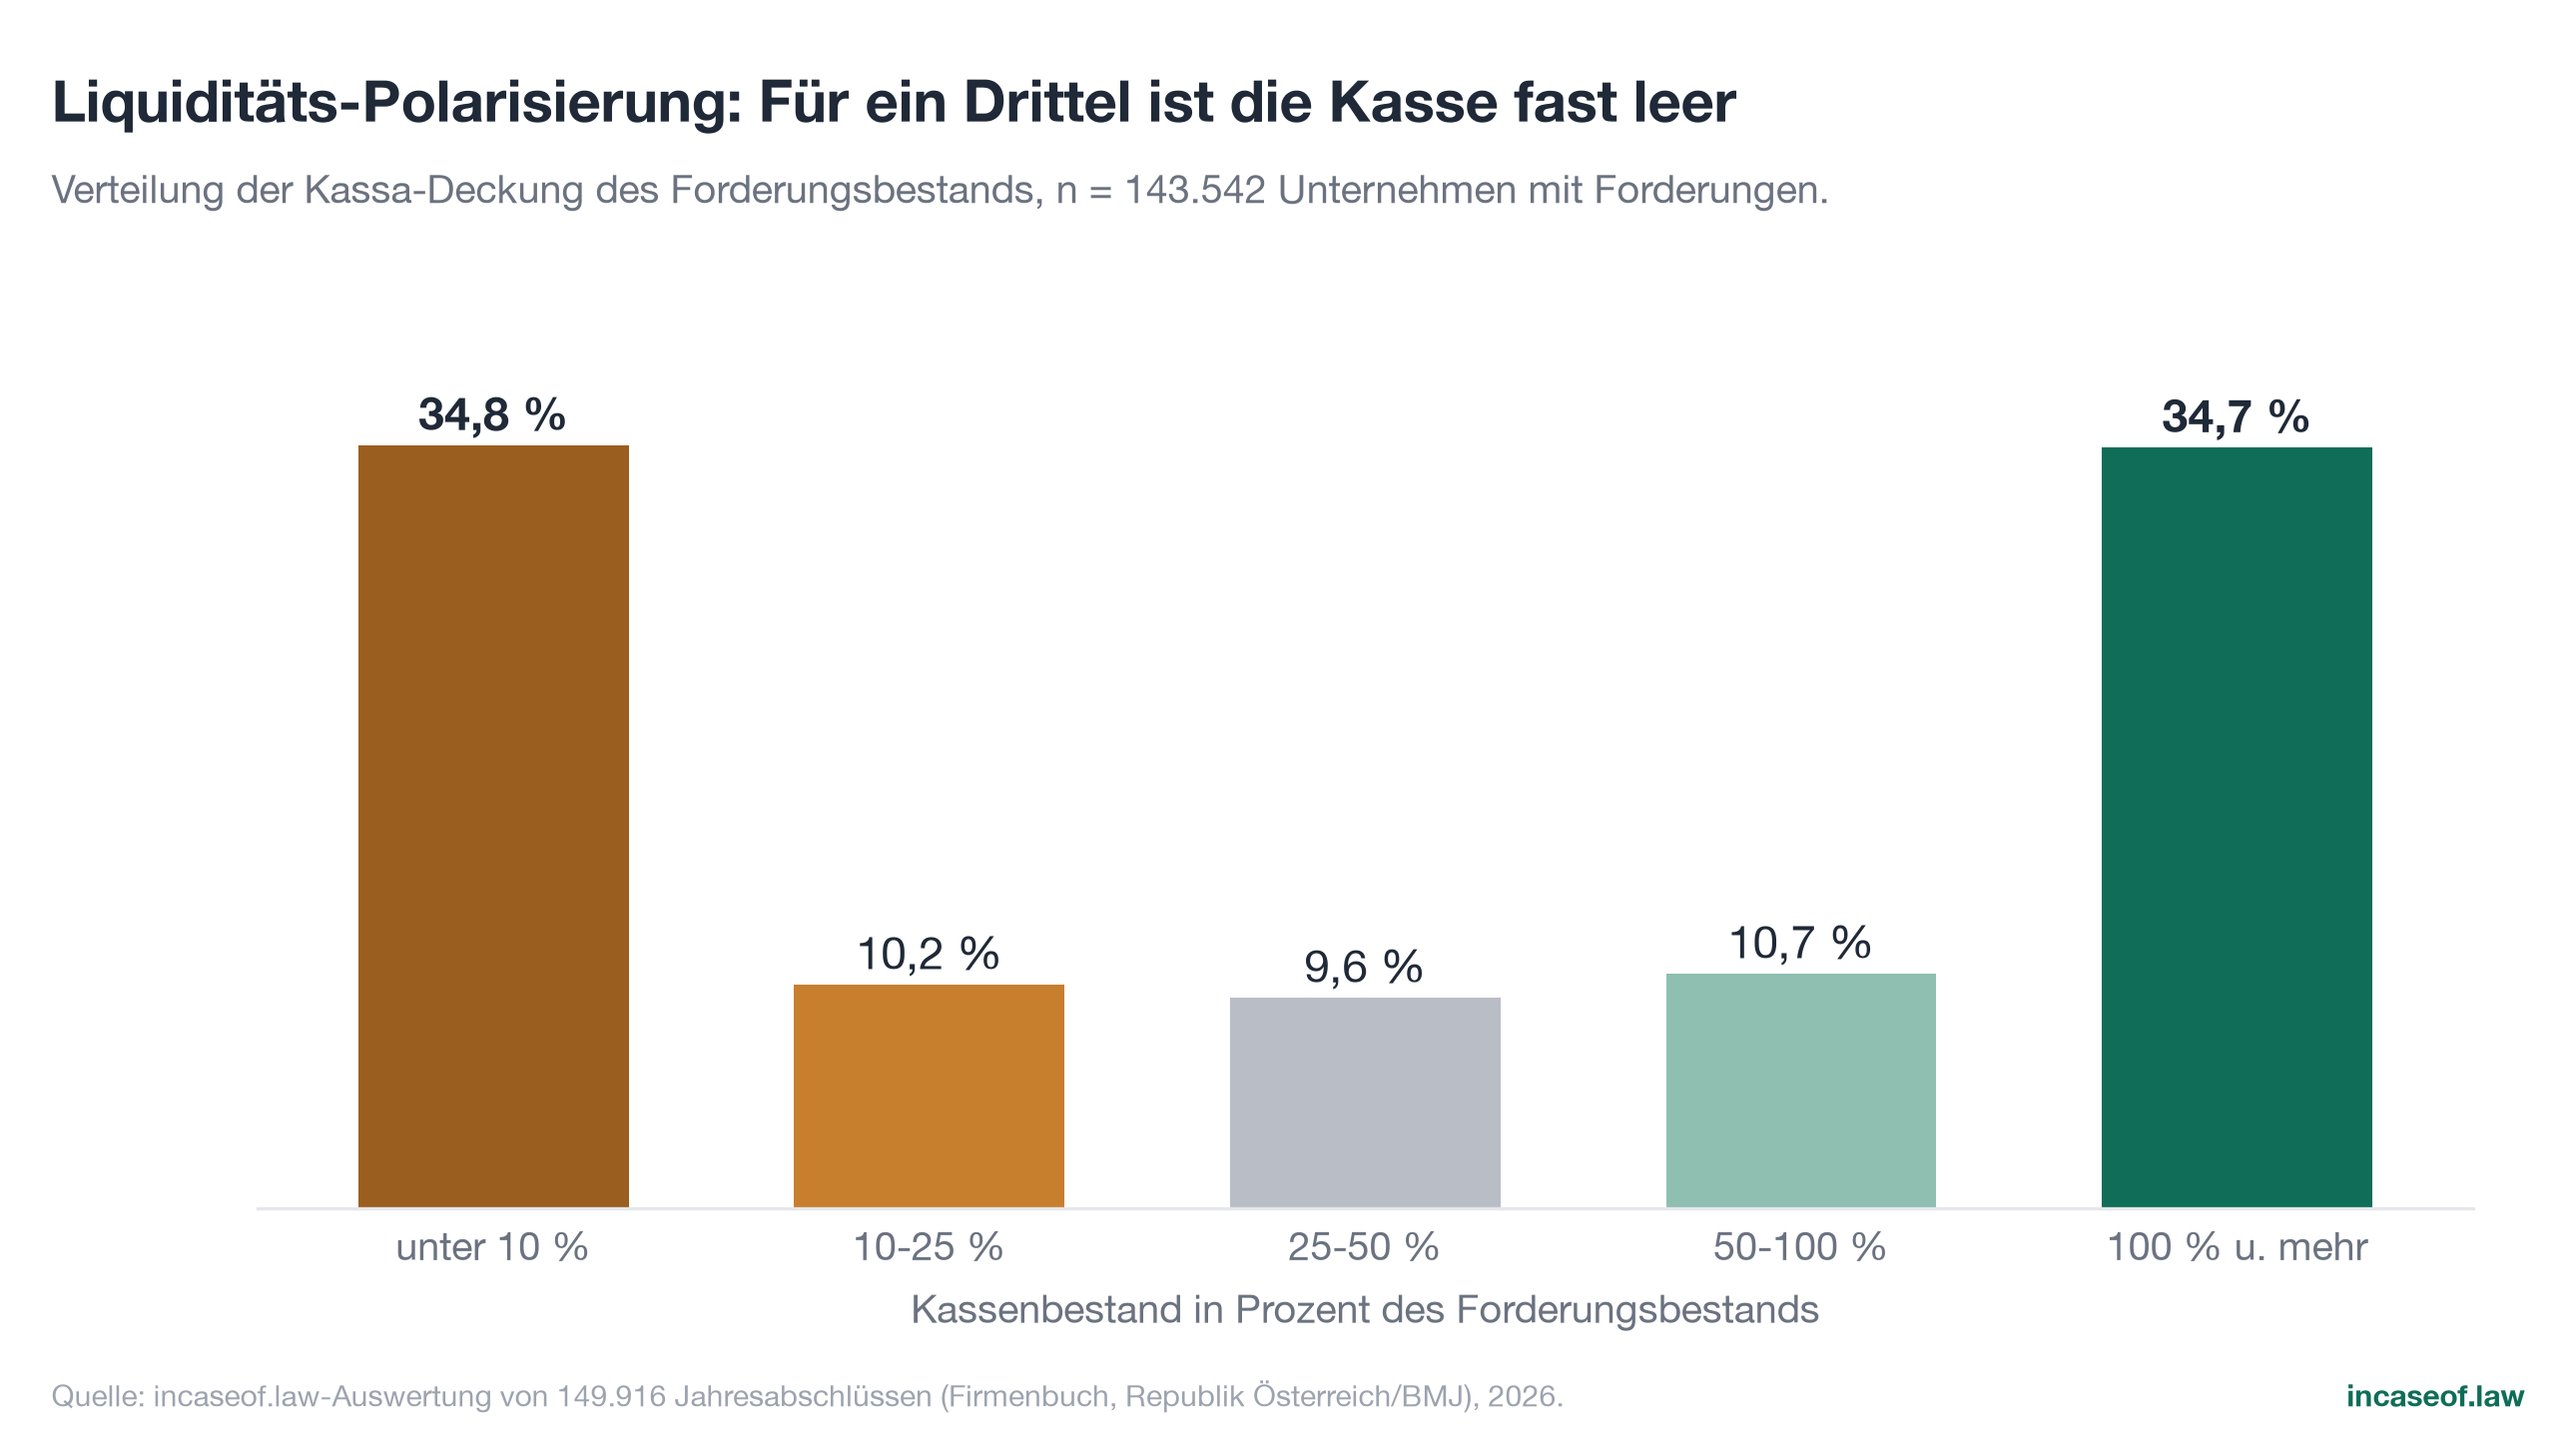
Third: liquidity coverage is polarised. 45.1 percent of companies holding receivables have liquid funds of less than a quarter of that stock (measured against all companies analysed: 43.2 percent). A good third (34.8 percent) does not even reach 10 percent cash coverage, while another third (34.7 percent) holds more liquidity than receivables. The size pattern is striking: large companies in particular fall below the 25 percent coverage mark most often, at 58.1 percent, which points to group structures and cash pooling.
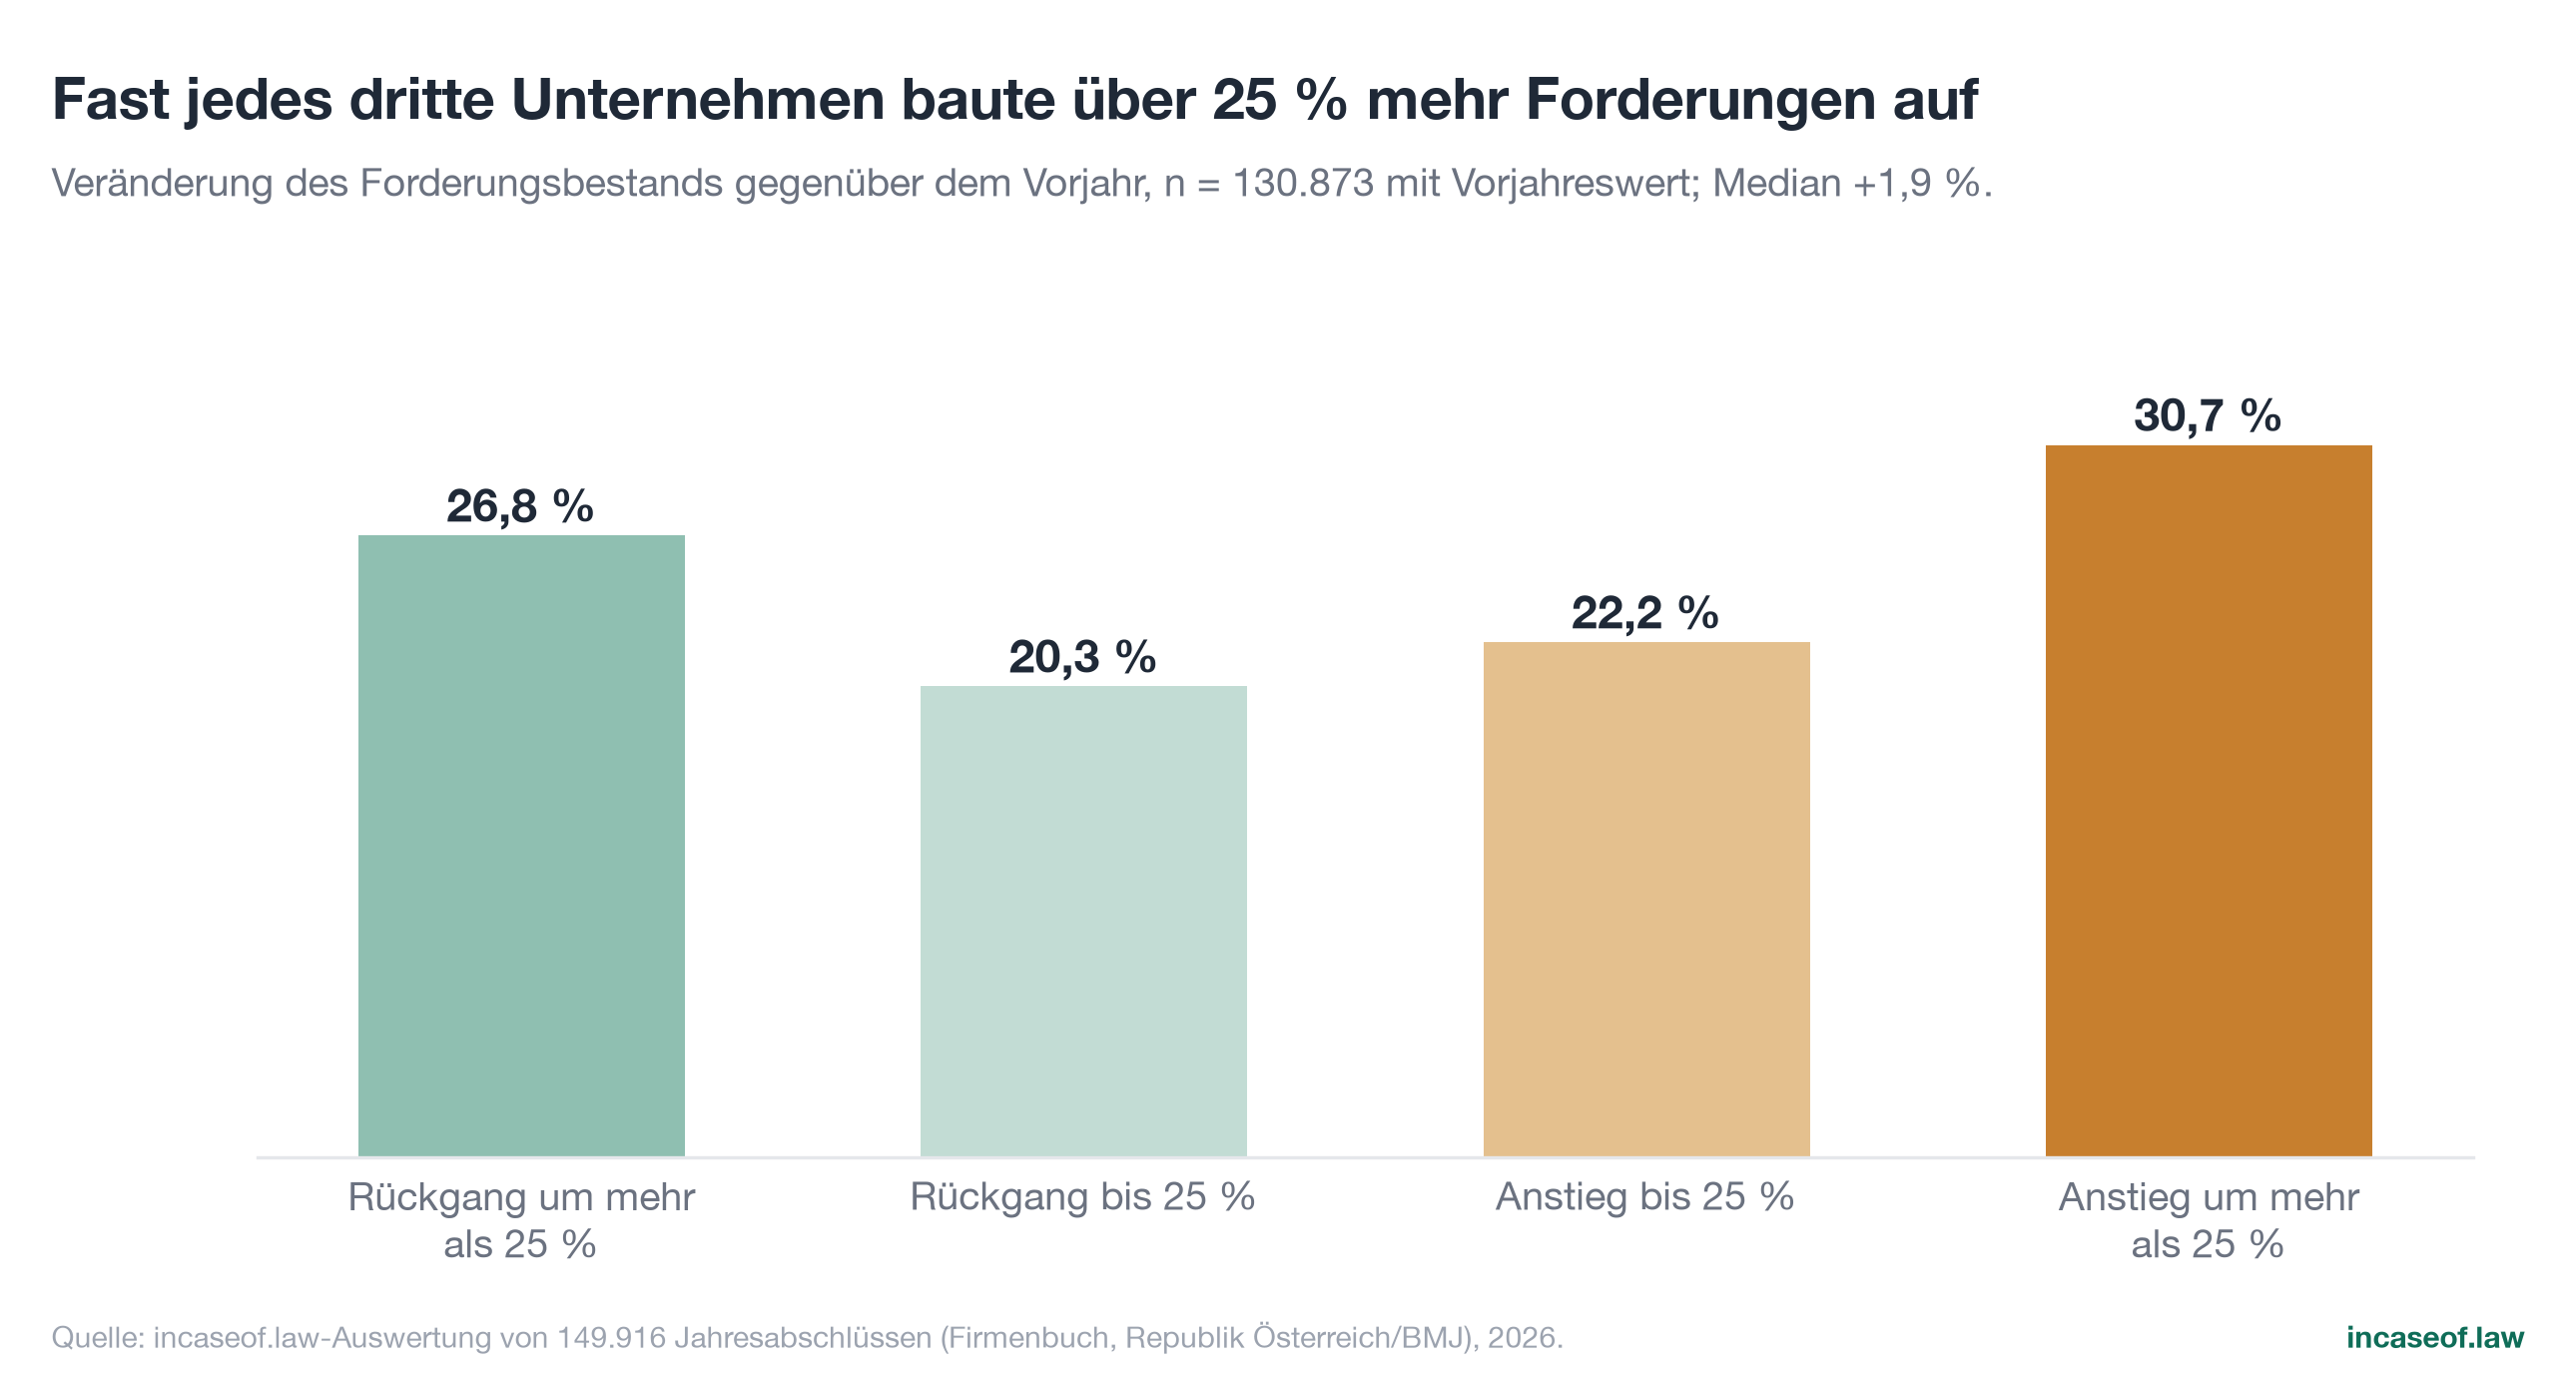
Fourth: the stock keeps growing. Among the 130,873 companies reporting a prior-year figure, the stock of receivables rose by a median of 1.9 percent; 52.9 percent of companies built receivables up, almost every third one (30.7 percent) by more than a quarter. On a basis adjusted for outliers and parsing anomalies, the aggregate volume grew by 4.1 percent.
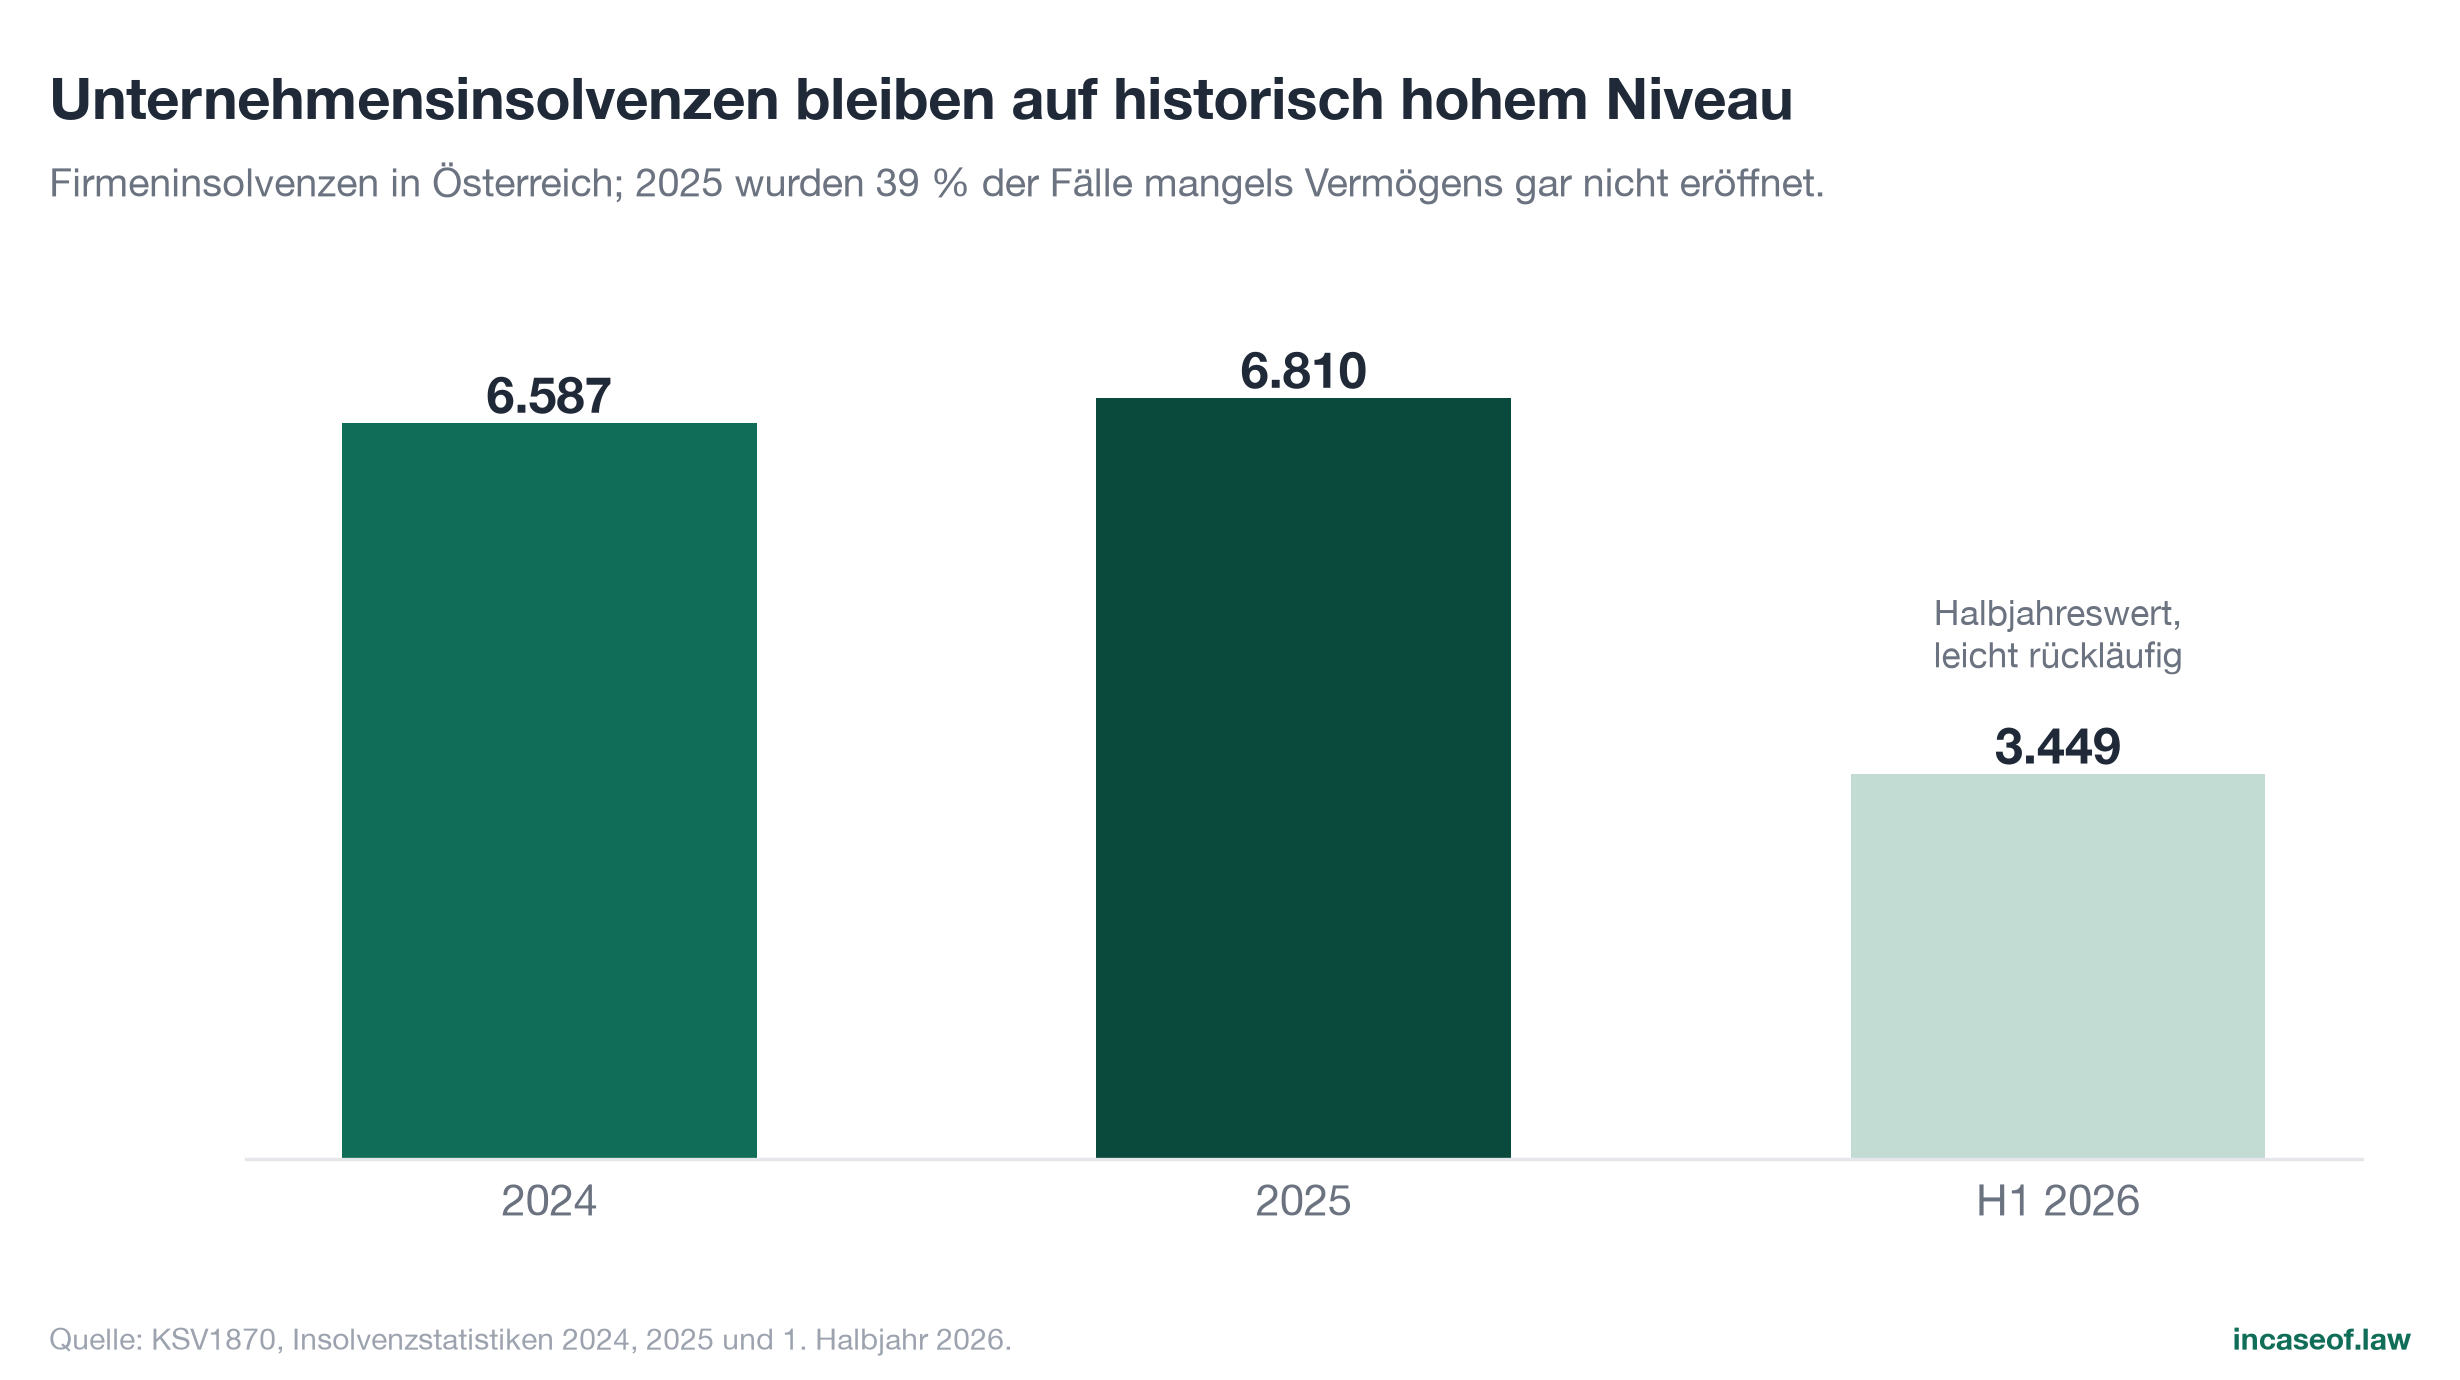
Fifth: the environment is making matters worse. Austria recorded historically high figures with 6,587 corporate insolvencies in 2024 and 6,810 in 2025; in the first half of 2026 the level fell only slightly, to 3,449 cases (KSV1870, 2025, 2026a, 2026b). 84 percent of Austrian companies report late B2B payments, against 77 percent in Western Europe (Atradius, 2026). According to Intrum (2026b), 63 percent worry more than ever about their customers' ability to pay, the highest value of all countries surveyed; 32 percent report productivity losses caused by collecting overdue receivables, more than twice the European average of 15 percent.
Sixth: tied-up capital has a real cost. In the current interest rate environment (deposit facility 2.25 percent, main refinancing rate 2.40 percent since 17 June 2026; OeNB, 2026a), the receivables stock of 194.9 billion euros corresponds to an annual financing or opportunity effect of roughly 7.8 billion euros at a 4 percent and up to 15.6 billion euros at an 8 percent cost of capital. This scenario calculation is not a damage estimate; it quantifies the order of magnitude of the capital commitment, before defaults, collection costs or productivity losses are taken into account at all.
The study is deliberately conservative in design: item B.II contains, alongside trade receivables, intra-group receivables and other assets; it is a measure of tied-up capital, not of overdue invoices. Where the data do not support a statement, for instance on sector allocation or on the turnover period of small entities, the study refrains from estimating and discloses the gap (Chapter 15). It is precisely in that delimitation that the finding lies: even under cautious assumptions, tied-up capital in 2026 is one of the largest and least noticed liquidity figures in the Austrian corporate landscape.
Key findings at a glance
Each of the following statements is citable on its own; unless stated otherwise, the source is the incaseof.law analysis of 149,916 companies from the Austrian commercial register (financial years 2024/2025, data as of 17 July 2026).
- Austrian limited companies had a total of 194.9 billion euros tied up in the balance sheet item "receivables and other assets" in 2024/2025; that corresponds to 38 percent of Austrian GDP in 2025 (incaseof.law, 2026).
- The stock of receivables held by Austrian limited companies is around three times as high as their entire cash and bank balances of 65.6 billion euros (incaseof.law, 2026).
- The typical Austrian limited company ties up 22.5 percent of its total assets in receivables (median 2024/2025); the mean is 33.4 percent (incaseof.law, 2026).
- The top one percent of Austrian companies holds 61.0 percent of the entire stock of receivables; the Gini coefficient of the distribution is 0.92 (incaseof.law, 2026).
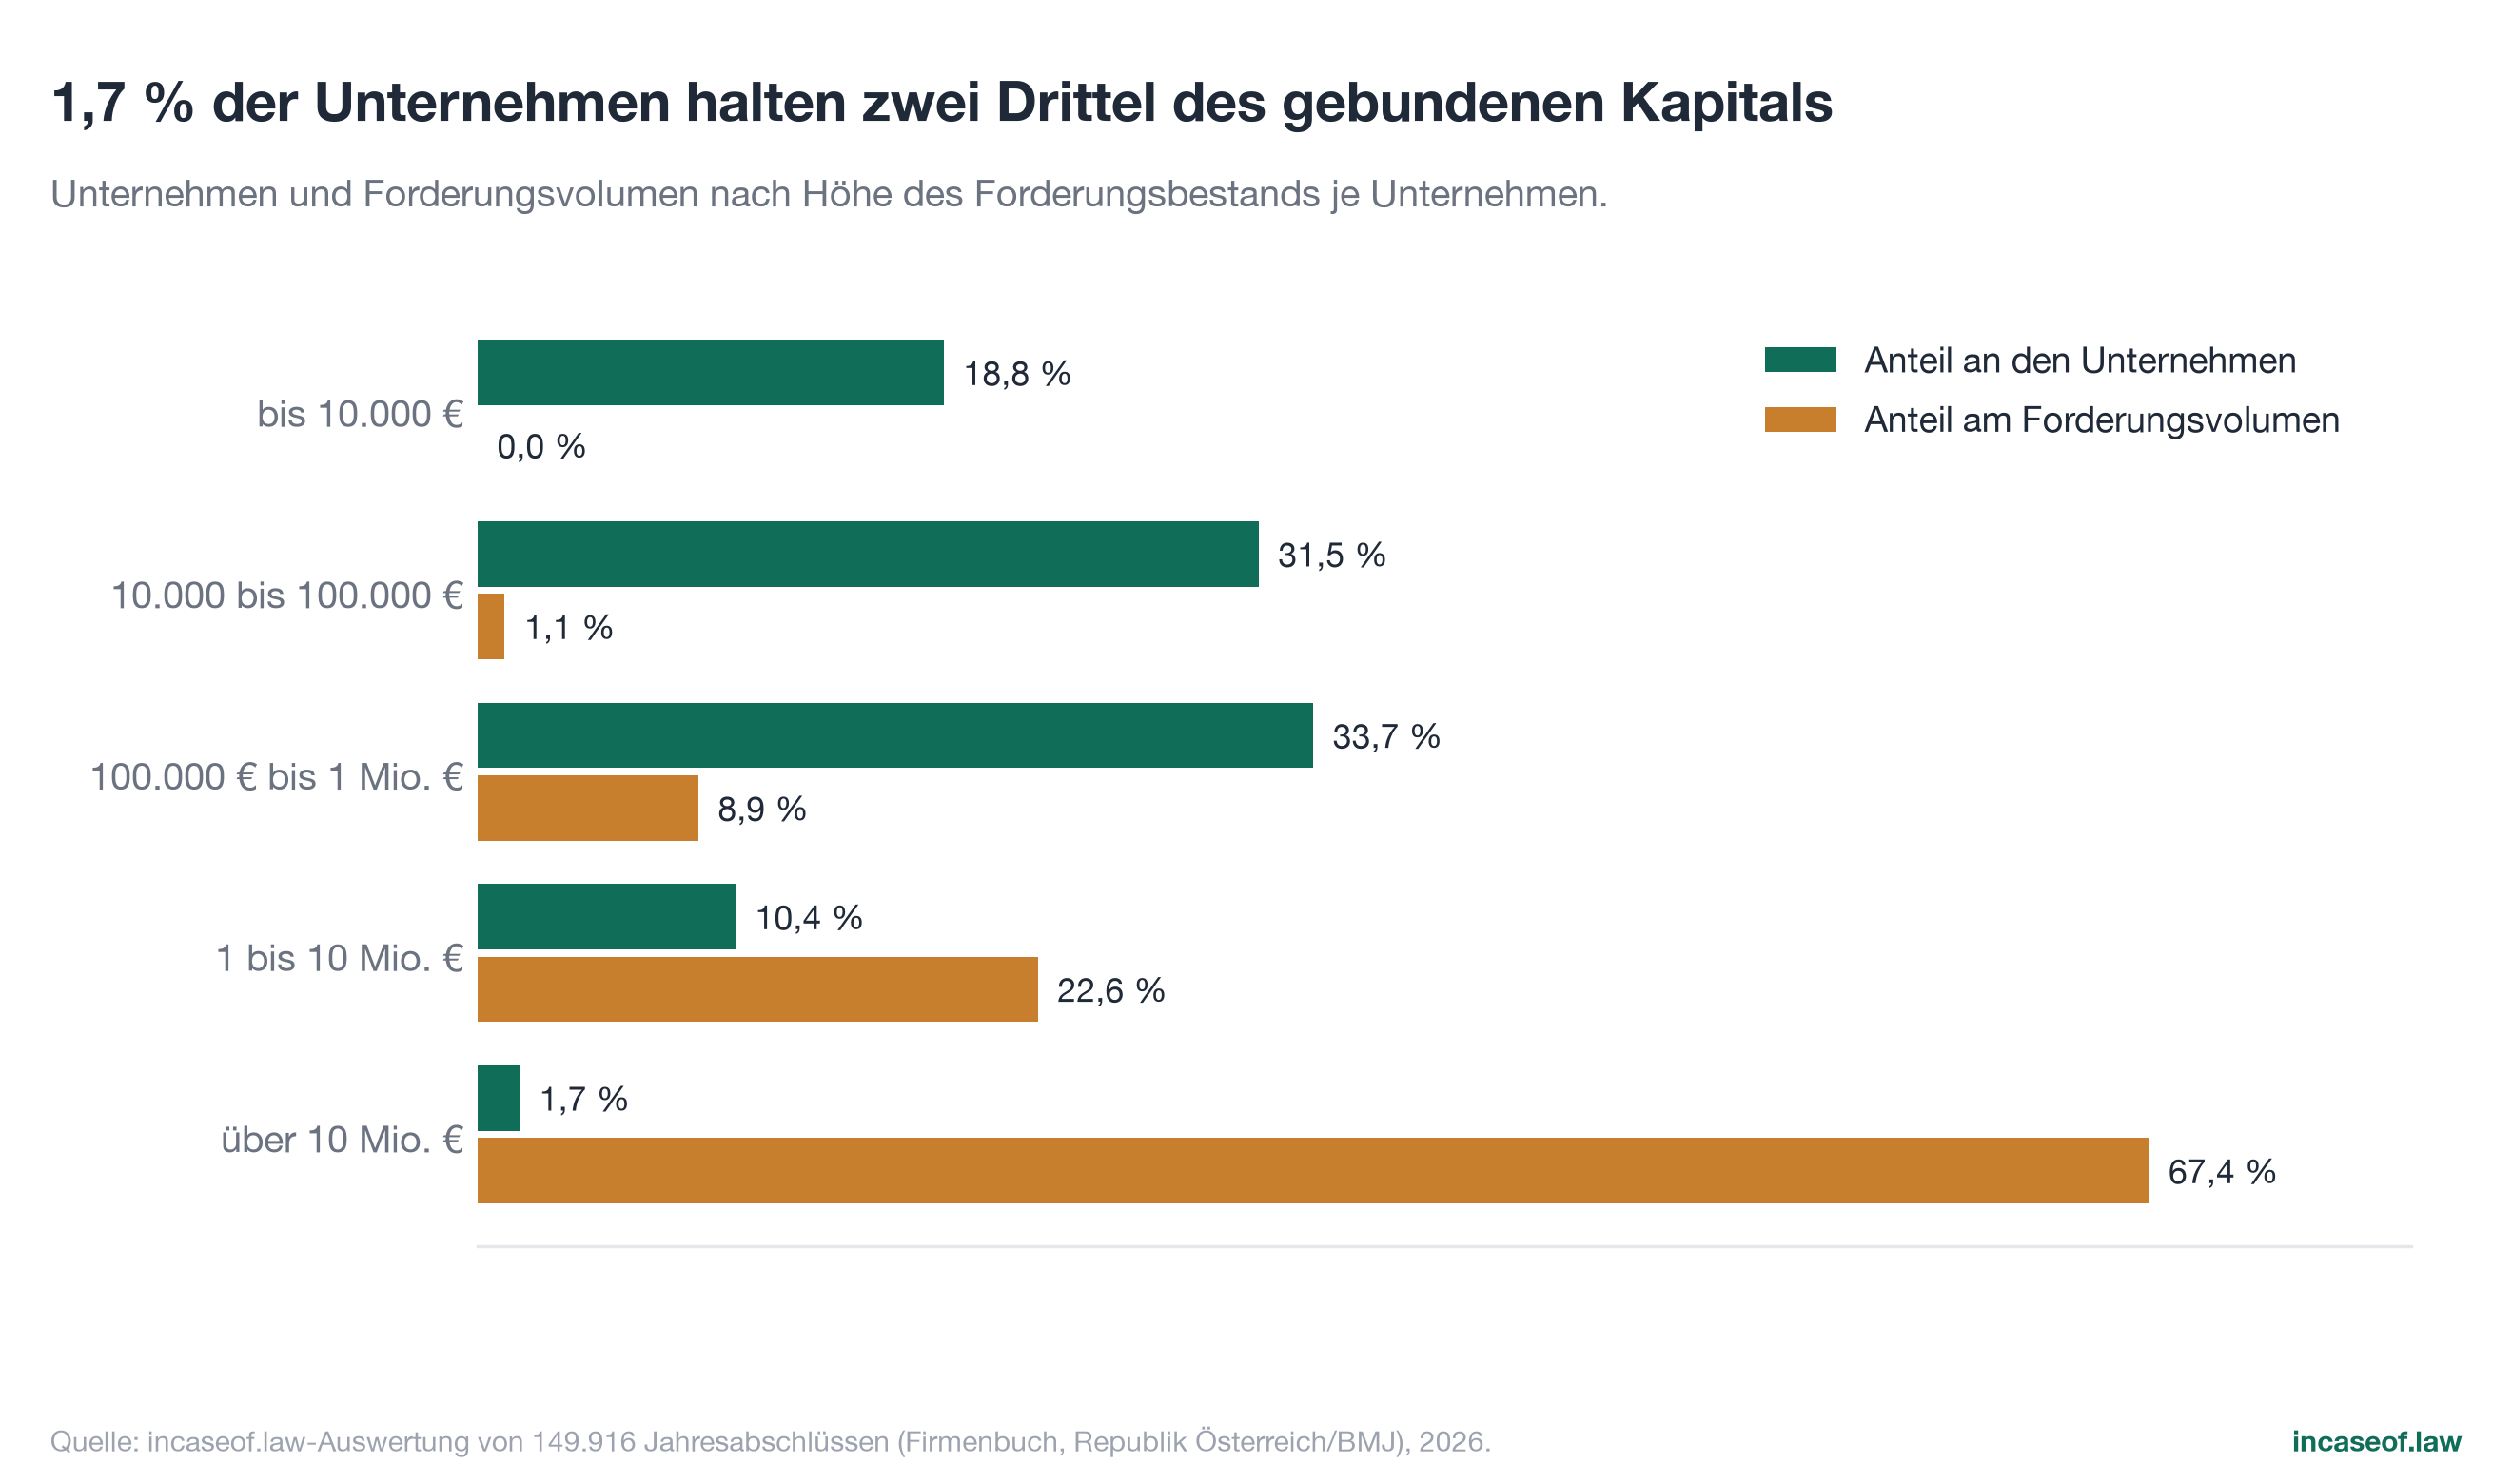
- 2,480 companies with receivables above 10 million euros (1.7 percent of companies) hold 67.4 percent of the tied-up capital in Austria (incaseof.law, 2026).
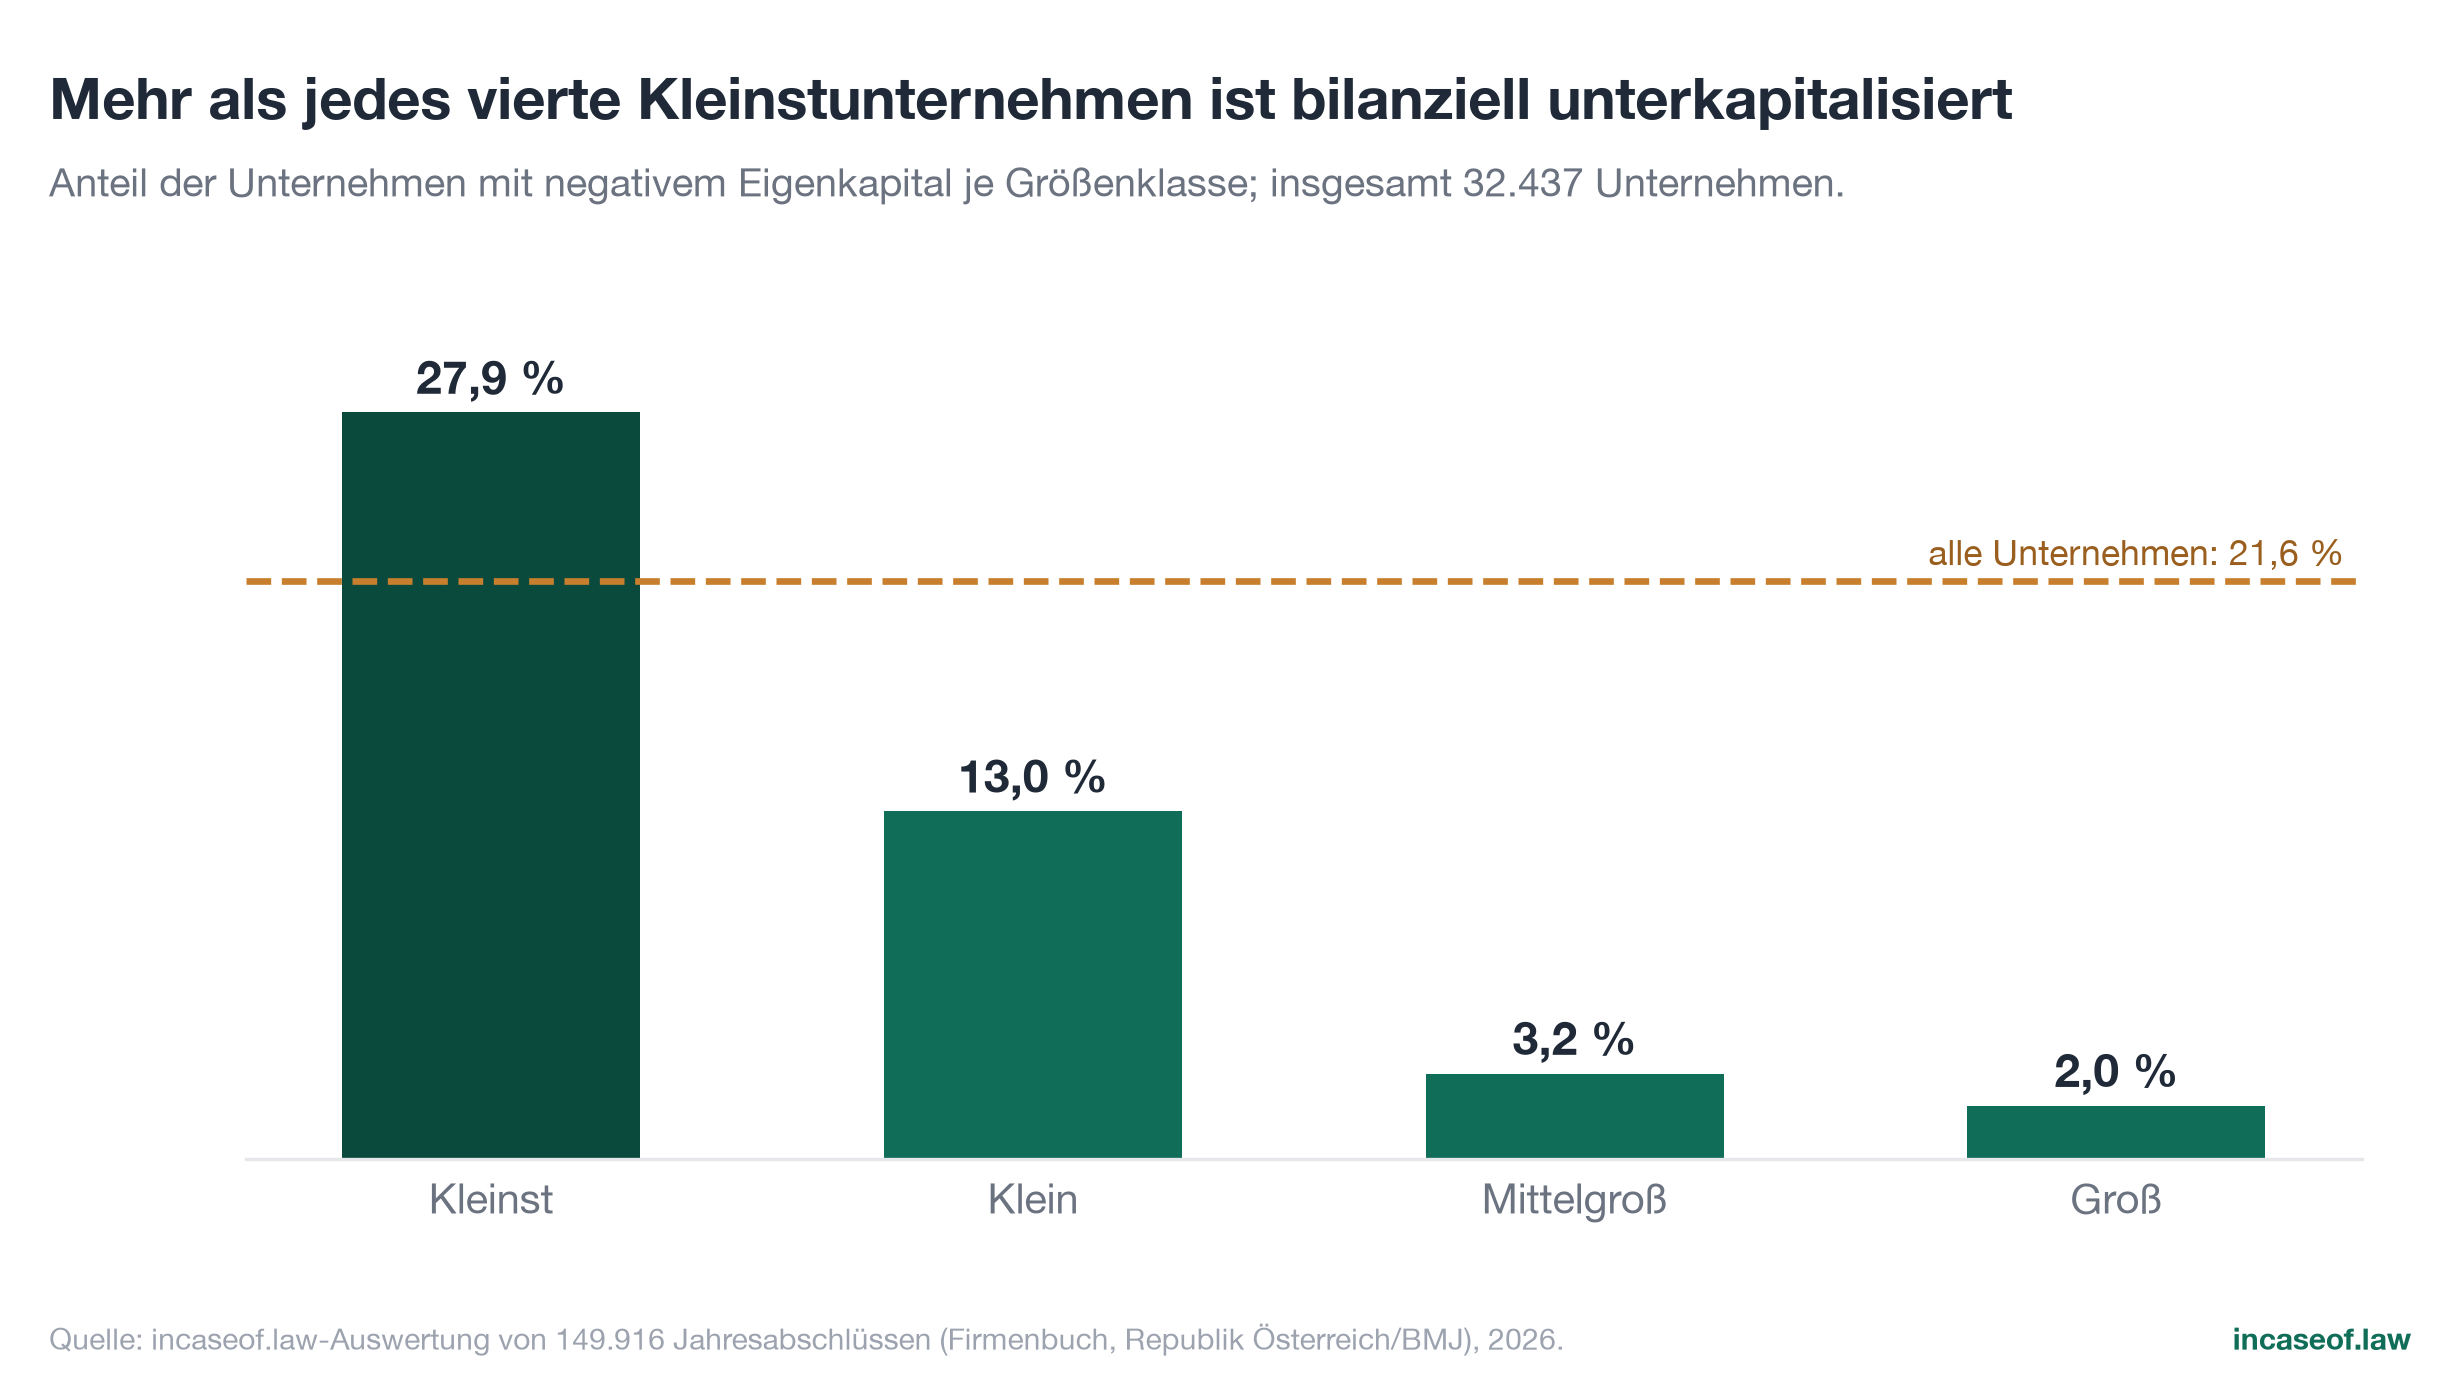
- 21.6 percent of Austrian limited companies reported negative equity in 2024/2025, and 27.9 percent among micro entities (incaseof.law, 2026).
- 9,139 Austrian limited companies combine negative equity with a receivables ratio above 50 percent of total assets (incaseof.law, 2026).
- 45.1 percent of Austrian companies holding receivables have liquid funds of less than a quarter of their receivables (incaseof.law, 2026).
- The stock of receivables of Austrian limited companies most recently rose by a median of 1.9 percent year on year; 30.7 percent of companies recorded an increase of more than 25 percent (incaseof.law, 2026).
- At a cost of capital of 6 percent, the Austrian receivables stock of 194.9 billion euros arithmetically causes 11.7 billion euros of financing and opportunity costs per year (incaseof.law, 2026, scenario calculation).
1. Introduction: why tied-up capital is the underrated liquidity topic of 2026
In this study, "tied-up capital" means that part of a company's assets which is reported on the balance sheet but is unavailable for payments, investment and crisis buffers because it is locked into receivables and related items. A receivable is a promise to pay, not money: turning it into liquidity depends on the payment discipline, the creditworthiness and, in a dispute, the legal enforcement on the other side. As long as the invoice is open, the creditor has to finance the service already rendered itself, out of own funds, supplier credit or bank credit.
Three developments turn this capital commitment into an economy-wide topic in 2026.
The insolvency burden remains historically high. After 6,587 corporate insolvencies in 2024 and 6,810 in 2025, KSV1870 registered a total of 3,449 company failures in the first half of 2026, a level that fell only slightly (KSV1870, 2025, 2026a, 2026b). For creditors, each of these insolvencies means the potential partial or total loss of open receivables; KSV1870 (2025) explicitly warns of the "pull effect" of insolvencies on economically stable business partners and of the risk of follow-on insolvencies.
Capital has a price again. After the decade of low interest rates, the Eurosystem deposit facility rate has stood at 2.25 percent since 17 June 2026, and the main refinancing rate at 2.40 percent (OeNB, 2026a). The statutory base rate has remained unchanged at 1.53 percent since 1 July 2025 (OeNB, 2026b). At the same time, the ECB (2026) reported in its Bank Lending Survey for the first quarter of 2026 an unexpectedly clear net tightening of credit standards for corporate loans of 10 percent, the sharpest since the third quarter of 2023. Anyone financing receivables is therefore doing so at real cost and with more restrictive banks behind them.
The business cycle offers little support. WIFO (2026) expects real growth of only 0.9 percent for 2026, after 0.8 percent in 2025. In such phases of weak growth, experience shows that companies draw more heavily on supplier credit in order to bridge scarce bank financing and thin cash flows; payment chains become longer and more fragile. That is exactly what the payment data show: 84 percent of Austrian companies report late B2B payments, clearly more than the Western European comparison figure of 77 percent (Atradius, 2026).
For measuring this topic, Austria offers an unusually good data basis by European standards. Limited companies must file their annual accounts electronically with the commercial register under Sections 277 et seq. UGB, and balance sheet item B.II "receivables and other assets" is visible as a separate figure in all size classes under Section 278 UGB, including for micro entities, which otherwise grant hardly any insight. Since commercial register data were classified as high-value datasets within the meaning of Implementing Regulation (EU) 2023/138, these accounts can be analysed by machine through an open interface. While the earnings position of small entities remains publicly invisible (no disclosure of the profit and loss account), the receivables side is observable across the board. Receivables are therefore one of the few liquidity indicators that can be surveyed for practically the entire Austrian population of companies subject to disclosure requirements.
This study uses precisely that gap in knowledge: it fully analyses the most recent filed annual accounts of 149,916 limited companies and answers questions that could previously be answered only selectively or not at all. How much capital is tied up in total? How is it distributed across companies and size classes? Where does a heavy receivables burden meet weak equity and scarce liquidity? And how does the stock change year on year? The approach is consistently conservative throughout: no estimates, no extrapolation beyond the data basis, every figure reproducible from the published analysis code.
The structure follows this logic: Chapter 2 describes the data basis and methodology, including the deliberate limits. Chapter 3 outlines the legal framework of late payment. Chapter 4 places the macroeconomic environment in context. Chapters 5 to 10 contain the empirical findings from the register data: overall picture, size classes, concentration, equity, liquidity and dynamics. Chapters 11 and 12 set the Austrian results in a European and sector-related context. Chapter 13 discusses consequences and options for action, Chapter 14 discloses the limitations, Chapter 15 draws the conclusion. A questions and answers chapter, the citation note and the full list of sources close the study.
2. Data basis and methodology
2.1 Legal basis of the data
Limited companies and entities treated as equivalent to them (in particular the GmbH & Co KG) must submit their annual accounts to the commercial register court under Section 277 UGB no later than nine months after the balance sheet date; submission must in principle be electronic, the only exception being entities with revenues of up to 70,000 euros (Section 277(6) UGB). The annual accounts must be drawn up within the first five months of the following year under Section 222 UGB. Since 1 January 2026, electronic filing runs exclusively through the justice platform JustizOnline in the structured format "JAb 4.0"; the earlier transmission route via FinanzOnline has been discontinued (WKO, 2025).
The structure of the balance sheet is laid down in Section 224 UGB. The asset item B.II analysed here carries the statutory title "receivables and other assets". It must be disclosed by all size classes under Section 278 UGB, including by micro entities, which under Section 242 UGB do not have to prepare notes and whose disclosure is limited to the balance sheet. Small entities disclose the balance sheet and the notes, but not the profit and loss account. Under Section 225(3) UGB, the amount with a remaining term of more than one year must additionally be stated separately for receivables. Failure to disclose is sanctioned by automatic penalty payments under Section 283 UGB (700 euros, halved for micro entities, repeated every two months); compliance with the disclosure obligation is correspondingly high.
Size classes follow Section 221 UGB as amended by the UGB Threshold Values Ordinance, Federal Law Gazette II No. 318/2024, applicable to financial years starting on or after 1 January 2024: micro entities up to 450,000 euros total assets and 900,000 euros revenues (an increase of around 29 percent), small entities up to 6.25 million euros total assets and 12.5 million euros revenues, medium-sized entities up to 25 million euros and 50 million euros (increases of 25 percent), large entities above that; in each case at least two of the three criteria total assets, revenues and number of employees (10/50/250) must be exceeded.
2.2 Data access and collection
The raw data come from the Austrian commercial register. The source of the register data is the Republic of Austria, represented by the Federal Ministry of Justice; access was obtained through the open interface under the Act on the Re-use of Public Sector Information (IWG). Commercial register data including annual accounts data are among the high-value datasets in the category "companies and company ownership" under Implementing Regulation (EU) 2023/138 and may be re-used free of charge (Section 14 IWG 2022). All aggregations, key figures and assessments in this study are the publisher's own calculations; they are marked as enrichment relative to the raw register data.
All electronic filings of annual accounts available through the change service of the interface for the period 1 January 2025 to 15 July 2026 were collected, 261,809 filings in total. Of these, 203,782 filings from 203,469 entities could be parsed by machine (two format generations: the FinanzOnline balance sheet schema used until 2025 and the JAb 4.0 format mandatory since 2026). Only 115 filings (0.04 percent) were technically unusable. Consolidated accounts were skipped; only separate financial statements were analysed.
2.3 Study population
For the analysis at company level, the most recent set of accounts per commercial register number was used (sorted by balance sheet date and filing date) and the population was limited to balance sheet dates from 1 January 2024 onwards. This yields n = 149,916 companies: 131,024 with a balance sheet date in 2024 (87.4 percent), 18,794 in 2025 (12.5 percent) and 98 with a divergent date in 2026. The 150,172 underlying filings include 256 cases in which the same entity filed two consecutive sets of accounts within the window; these double counts were removed, so that each entity appears exactly once with its most recent accounts.
To put coverage in context: at the collection date, the commercial register listed 203,469 entities with at least one electronically parsed set of accounts; the difference from the study population consists predominantly of entities whose most recent available accounts relate to a financial year before 2024 (late filers, non-filers and inactive entities). The population therefore comprises practically the entire population subject to disclosure requirements with current accounts. Not included, by definition, are sole traders, registered partnerships with natural persons as general partners, and members of the liberal professions without a disclosure obligation; according to the WKO membership statistics (WKO, 2026b), around 76 percent of Austrian businesses are sole traders. The study therefore describes the disclosing core of the corporate landscape, not its entirety (see Chapter 14).
2.4 Definitions of key figures
All key figures follow fixed rules documented in the analysis code:
- Stock of receivables: the value of item B.II "receivables and other assets" according to the most recent annual accounts. Aggregates add up positive stocks.
- Receivables ratio: B.II divided by total assets; calculated only where total assets are positive, receivables are non-negative and the ratio is at most 101 percent. 651 cases (0.4 percent) were excluded under these rules (431 without positive total assets, 203 with a negative receivables figure, 44 with a ratio above 101 percent, in each case parsing or reporting anomalies); usable: n = 149,265.
- Equity ratio and negative equity: equity as reported on the balance sheet; negative where the reported figure is below zero. The field is populated in all 149,916 sets of accounts.
- Cash coverage: cash on hand and bank balances (item B.IV) divided by the stock of receivables; calculated for the 143,542 companies with a positive stock of receivables and a populated cash field.
- Year-on-year change (YoY): the change in the B.II value against the prior-year figure reported in the same set of accounts; calculated for 130,873 companies with a positive prior-year figure. For aggregate sums, a plausibility rule is additionally applied (prior-year figure at most 1.5 times current total assets), because in the older data format prior-year figures inflated by a factor of 1,000 occur in isolated cases; this rule excludes 3,670 cases. Medians are reported on the unfiltered basis.
- Remaining term of more than one year: the "of which" note under Section 225(3) UGB is contained in structured form only in the JAb 4.0 format and is therefore analysed exclusively for the corresponding sub-sample (n = 2,001). In substance, the remaining term denotes the time until the receivable falls due, not its age; overdue receivables are already due and do not appear in this note.
2.5 What item B.II measures and what it does not
The item "receivables and other assets" is deliberately broader than the concept of the open customer invoice. Alongside trade receivables it covers receivables from affiliated companies (for instance from intra-group settlement and cash pooling) and other receivables such as tax credits, deposits and loans granted. Only large entities disclose the breakdown; for small entities and micro entities only the aggregate is visible. The 194.9 billion euros are therefore to be read as capital tied up in receivables and settlement assets, not as the sum of unpaid invoices.
An external comparison figure makes the delimitation tangible: the OeNB financial accounts (2026c) report trade credit (receivables side) of around 64.7 billion euros for non-financial corporations in the first quarter of 2026. This macroeconomic figure is more narrowly defined (at its core classic trade receivables and prepayments, consolidated by sector) and, as expected, lies clearly below the B.II aggregate measured here. The two figures do not contradict each other; they measure differently broad sections of the same phenomenon. For the question posed by this study, namely how much capital sits in promises to pay rather than in available liquidity, the balance sheet perspective of B.II is the appropriate one.
2.6 Reproducibility
All figures in this study come from a single analysis script (Python) that processes the raw database in read-only mode and generates all tables and charts deterministically. The script, the result tables (CSV) and the complete key figures file accompany the study (Appendix A). Every figure mentioned in the text can therefore be reproduced at the push of a button; rounding is commercial, to one decimal place or to whole millions or billions of euros.
3. Legal framework: late payment in commercial transactions
3.1 Austria: default interest, flat-rate compensation, deadlines
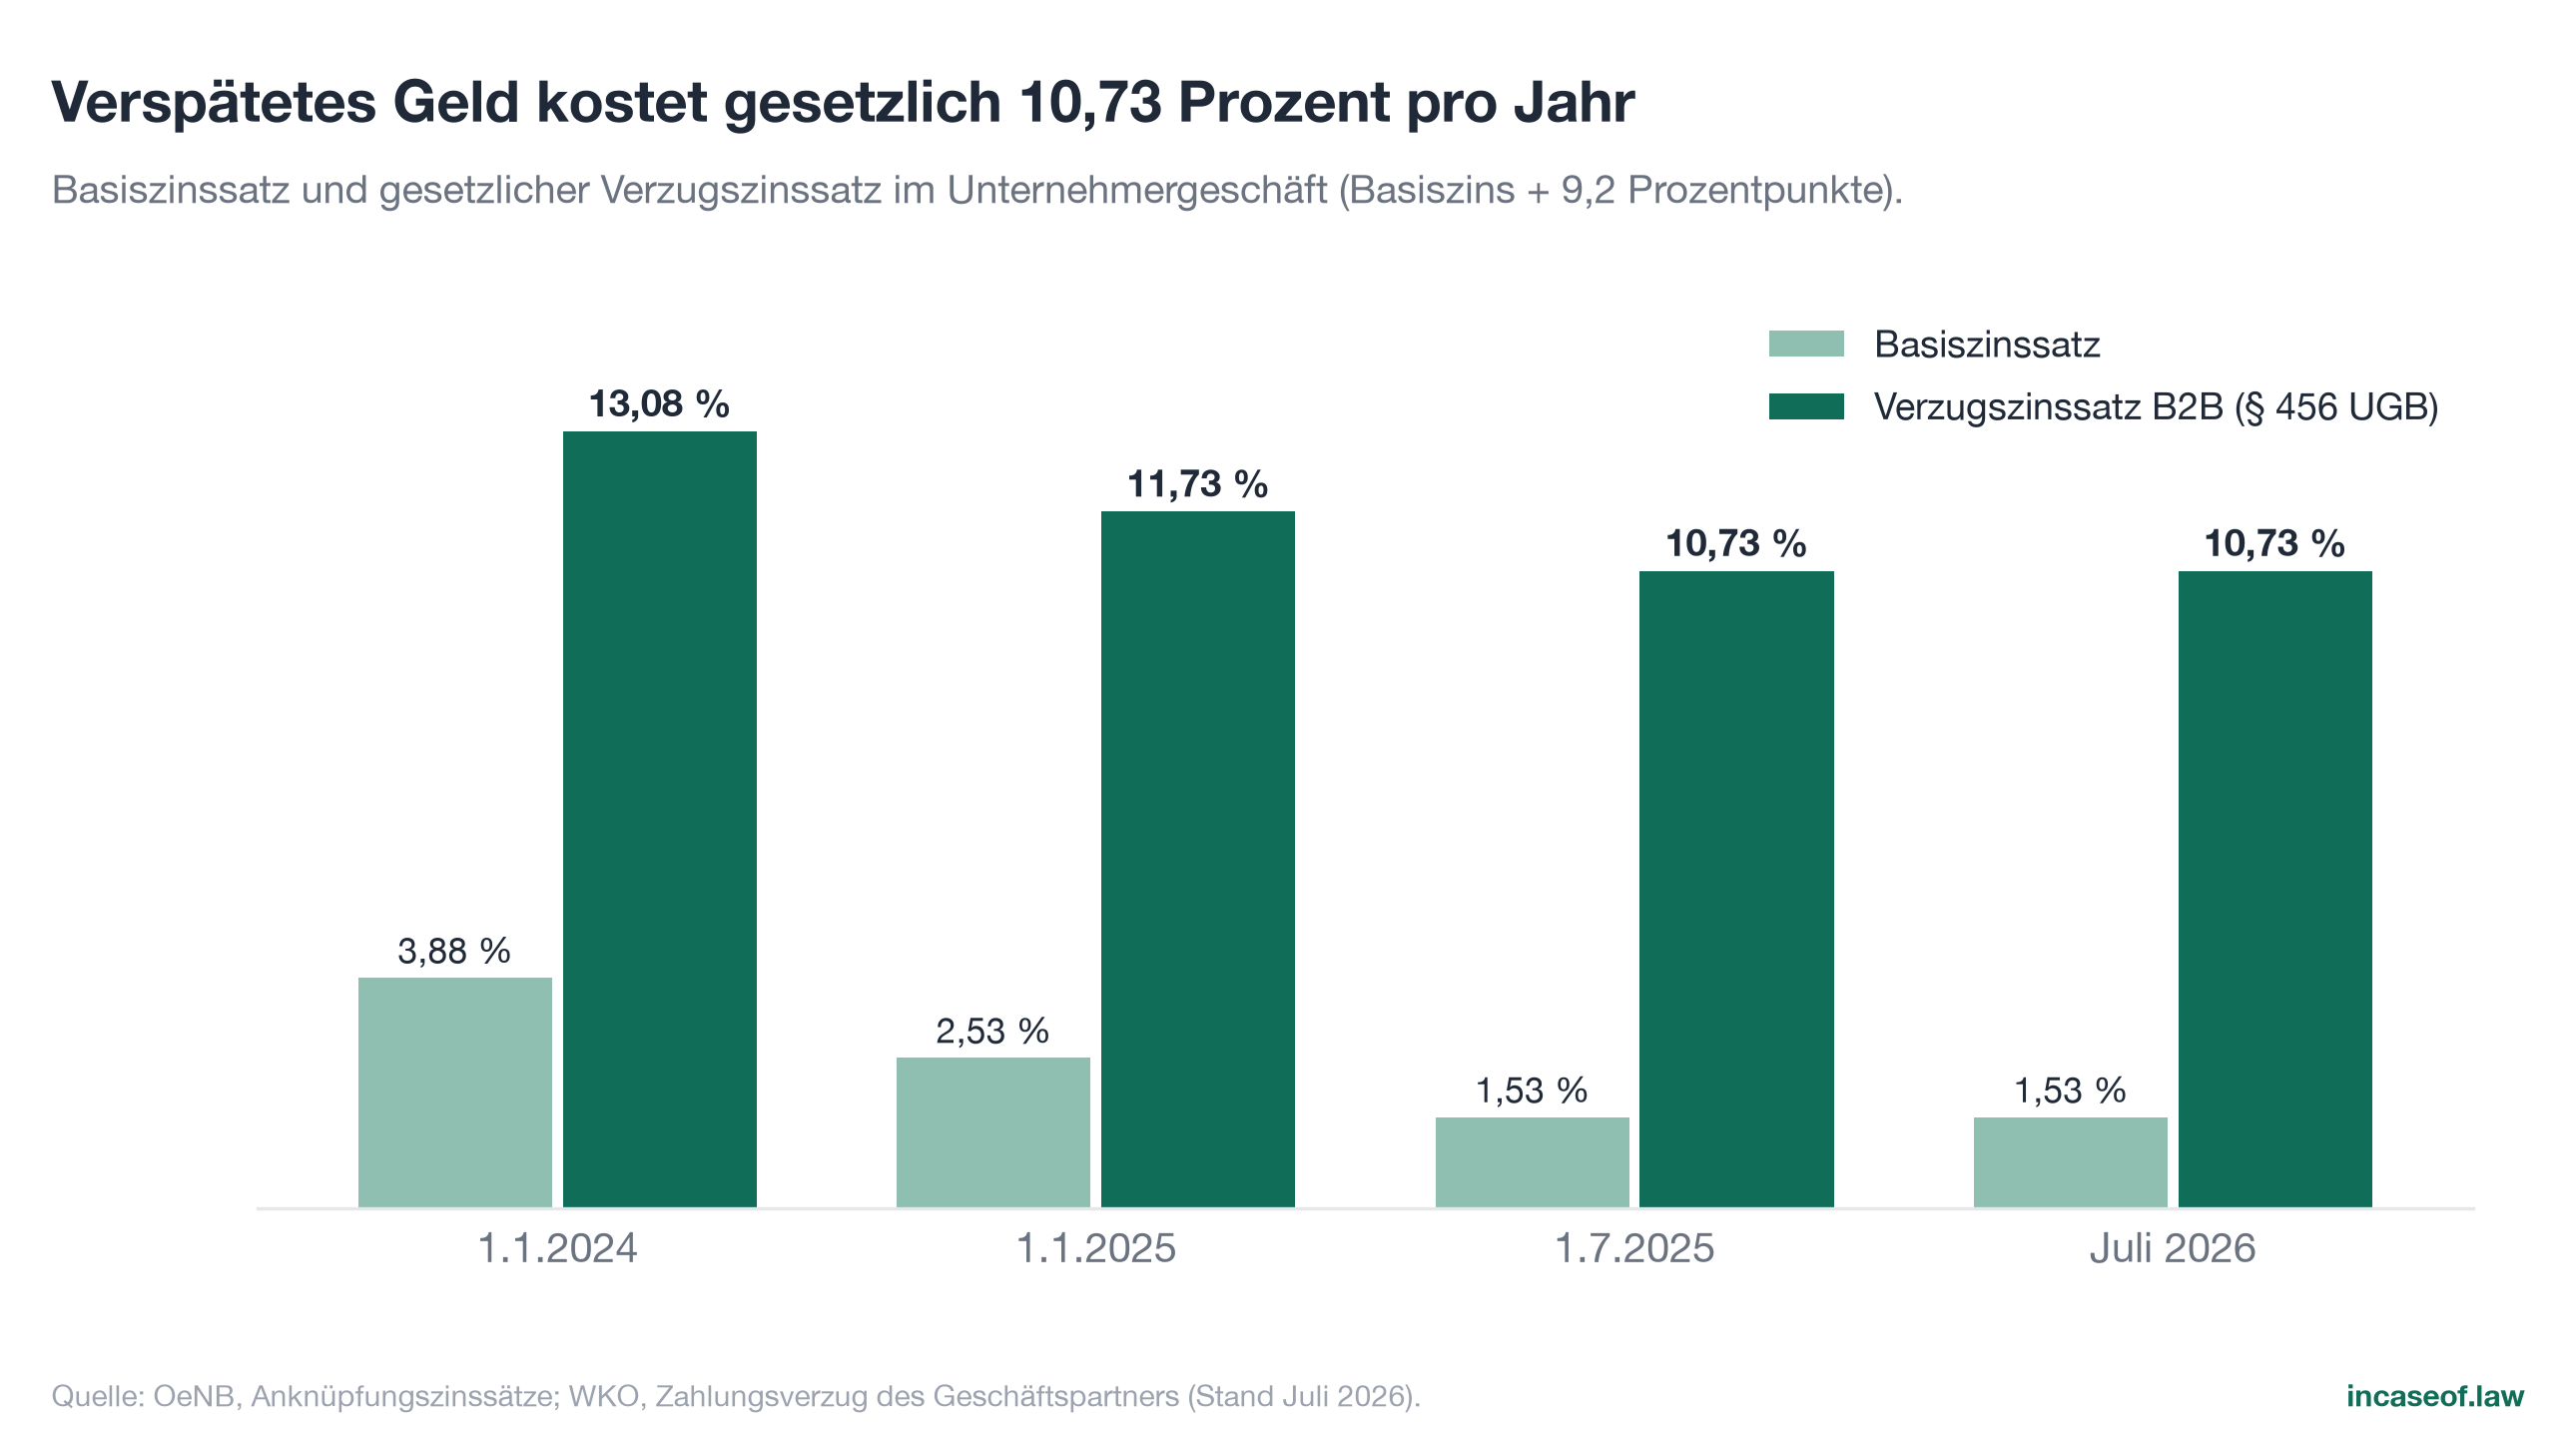
For monetary claims between businesses, Section 456 UGB applies in Austria: the statutory rate of default interest is 9.2 percentage points above the base rate. With a base rate of 1.53 percent (unchanged since 1 July 2025; OeNB, 2026b), this currently produces 10.73 percent per year (WKO, 2026a). In addition, under Section 458 UGB the creditor is entitled to a flat amount of 40 euros for collection costs, irrespective of the actual expense. A reminder is not a precondition for taking the matter to court: if the claim is due and unpaid, proceedings can in principle be started immediately (WKO, 2026a). Contractual payment terms are limited by Section 459 UGB: terms of up to 60 days are permissible in any event; longer terms only where they are not grossly unfair to the creditor.
The legal finding is therefore unambiguous: Austrian law provides creditors with a comparatively sharp set of instruments. The capital commitment documented in the empirical chapters is thus not the result of missing legal foundations, but of market practice, asymmetries of power and the costs of enforcement.
3.2 European Union: Directive 2011/7/EU and the planned regulation
The framework under Union law is Directive 2011/7/EU on combating late payment in commercial transactions. It expressly aims to protect companies, in particular SMEs, against late payment (Art. 1(1)) and sets three core standards for that purpose: between companies, the contractual payment term must in principle not exceed 60 days (Art. 3(5)), public authorities must pay within 30 days (Art. 4(3)), and the statutory rate of default interest is at least 8 percentage points above the reference rate (Art. 2(6)), supplemented by the flat compensation of at least 40 euros (Art. 6(1)) (European Union, 2011). Austria has transposed these requirements in Sections 456 to 459 UGB in a way that goes beyond them (9.2 instead of 8 percentage points).
The European Commission itself underlines the economic policy significance of the topic: according to its figures, late payment is a contributing cause of around a quarter of corporate insolvencies in the EU; in her 2022 State of the Union address, Commission President von der Leyen stated that "one in four bankruptcies" is due to invoices not being paid on time (European Commission, 2022; EU Payment Observatory, 2023). Against this background, the Commission proposed a Late Payment Regulation in September 2023 (COM(2023) 533 final, procedure 2023/0323(COD)), which among other things provided for a hard 30-day limit. The European Parliament adopted its first-reading position on 23 April 2024; since then the file has been waiting for the Council's position. At the editorial cut-off of this study (July 2026), the proposal is still pending in the legislative procedure, neither adopted nor withdrawn (European Parliament, 2024/2026). For companies, Directive 2011/7/EU together with its national transposition therefore remains decisive for the foreseeable future.
3.3 The debt collection legal framework in Austria
The commercial collection of third-party claims is doubly circumscribed in Austria. Under trade law, debt collection institutes are a regulated trade (Section 94(36) GewO 1994); Section 118 GewO governs the scope of the activity, with enforcement before the courts remaining reserved to lawyers. On the cost side, the Ordinance on the maximum remuneration rates payable to debt collection institutes (Federal Law Gazette No. 141/1996) limits the amounts that may be charged to debtors as collection costs. Collecting receivables is therefore not an unregulated space for pressure, but a formalised part of the legal enforcement system, with a certificate of competence, proportionality limits and cost caps. For the macroeconomic classification in this study that is relevant, because professional collection thus follows predictable rules and the enforcement costs for creditors are limited and transparent.
4. Macroeconomic context: insolvencies, interest rates, business cycle
4.1 Insolvencies in Austria
Insolvency activity is the worst case of the receivables landscape: every corporate insolvency turns creditors' open receivables into losses or hopes of a quota. Austria is at a historically high level here. KSV1870 (2025) counted a total of 6,587 corporate insolvencies for the year 2024; in 2025 the figure rose to 6,810 cases (KSV1870, 2026a). In the first half of 2026, 3,449 company failures were registered, a level that fell only slightly and shows no sign of rapid relief (KSV1870, 2026b).
Behind the case numbers stand two structural findings that are central for creditors. First, the liabilities: in 2024, provisional insolvency liabilities added up to 18.9 billion euros, shaped by several large insolvencies; in 2025 they stood at 8.48 billion euros despite a higher case count, because very large individual cases were rarer (KSV1870, 2025, 2026a). Second, the quality of the proceedings: in 2025, more than 2,600 insolvency applications were not opened for lack of assets to cover the costs, around 39 percent of all company failures (KSV1870, 2026a). In such cases there is typically not even enough substance left for proceedings; creditors come away practically empty-handed. For the analysis of receivables this means that a substantial part of insolvency activity destroys receivables completely and without any quota.
KSV1870 (2025) also explicitly describes the "pull effect" of high insolvency numbers: payment defaults at debtors are passed on to their creditors and create the risk of follow-on insolvencies even at companies with an intact business model. It is precisely this transmission mechanism that runs through the balance sheet item measured by this study.
4.2 The European insolvency picture
The situation has worsened in the European environment as well. Creditreform Wirtschaftsforschung counted 169,496 corporate insolvencies in Western Europe in 2023, 190,449 in 2024 and 197,610 in 2025, the highest level in more than twenty years (Creditreform, 2026; figures as first published in the respective annual reports, later revisions of individual annual values are possible). With an increase of 4.3 percent, Austria was in the European midfield in 2025 and therefore not among the countries with declining numbers (Creditreform, 2026). The rise among service providers is striking (Western Europe 2025: plus 8.7 percent), a sector in which receivables are often the most important asset.
For the Austrian receivables landscape this European dimension is directly relevant: export-oriented companies hold receivables against foreign customers, and payment shocks in neighbouring markets feed back into domestic debtor quality along the supply chains.
4.3 Interest rate and credit environment
The financing costs of tied-up capital have shifted structurally. After the rate-cutting cycle of 2024/2025, the Eurosystem raised key interest rates again in June 2026: since 17 June 2026, the rates are 2.25 percent for the deposit facility, 2.40 percent for the main refinancing operations and 2.65 percent for the marginal lending facility (OeNB, 2026a). The Austrian base rate relevant for default interest has stood unchanged at 1.53 percent since 1 July 2025, after 3.88 percent at the start of 2024 and 2.53 percent at the start of 2025 (OeNB, 2026b).
At the same time the credit channel remains tight: in the ECB Bank Lending Survey (2026), euro area banks reported a net tightening of credit standards for corporate loans of 10 percent for the first quarter of 2026, the sharpest since the third quarter of 2023 and more pronounced than the banks themselves had expected. Companies therefore cannot readily bridge missing payments with cheap or easily available bank credit. Every euro tied up in receivables is thus a genuinely expensive euro again in 2026, and every late payment extends the expensive interim financing.
4.4 The business cycle
The cyclical basis remains narrow. After two years of recession, the Austrian economy grew by 0.8 percent in real terms in 2025; for 2026 WIFO (2026) expects 0.9 percent and IHS 0.8 percent, followed by 1.1 percent for 2027. Individual sectors continue to carry legacy burdens: real value added in construction fell by 4.2 percent in 2024 (WIFO, 2026); as early as spring 2024, WKO (2024) had spoken of the sector's second consecutive year of recession.
For working capital, this combination is characteristic: growth that is too weak to build liquidity buffers, but strong enough to let revenues and hence receivables continue to grow. The empirical chapters show how this constellation becomes visible in the balance sheets.
5. The overall picture: 194.9 billion euros of tied-up capital
5.1 The stock
In their most recent annual accounts, the 149,916 entities analysed report a combined 194.9 billion euros in the item "receivables and other assets". To put that magnitude in context:
- It corresponds to 38.0 percent of Austrian gross domestic product in 2025 of 512.8 billion euros (Statistik Austria, 2026).
- It corresponds to 20.5 percent of the aggregate balance sheet total of all entities analysed of 951.8 billion euros: a good one in five euros of corporate assets in the disclosing sector is a third party's promise to pay.
- It is around three times as high as the entire liquid funds of the same companies: cash on hand and bank balances add up to 65.6 billion euros (Figure 1).
- Arithmetically, each entity carries an average of 1.30 million euros of receivables. This mean describes the macroeconomic dimension, not the typical company: the median stock of receivables is around 78,000 euros.
The delimitation from Chapter 2 remains important: B.II contains, alongside trade receivables, intra-group settlement balances, loans and other assets. The 194.9 billion euros are tied-up capital, not overdue invoices. Yet it is precisely this broad definition that makes the figure the relevant measure for the question of how strongly corporate assets depend on the ability and the willingness of third parties to pay.
5.2 Median against mean: a skewed landscape
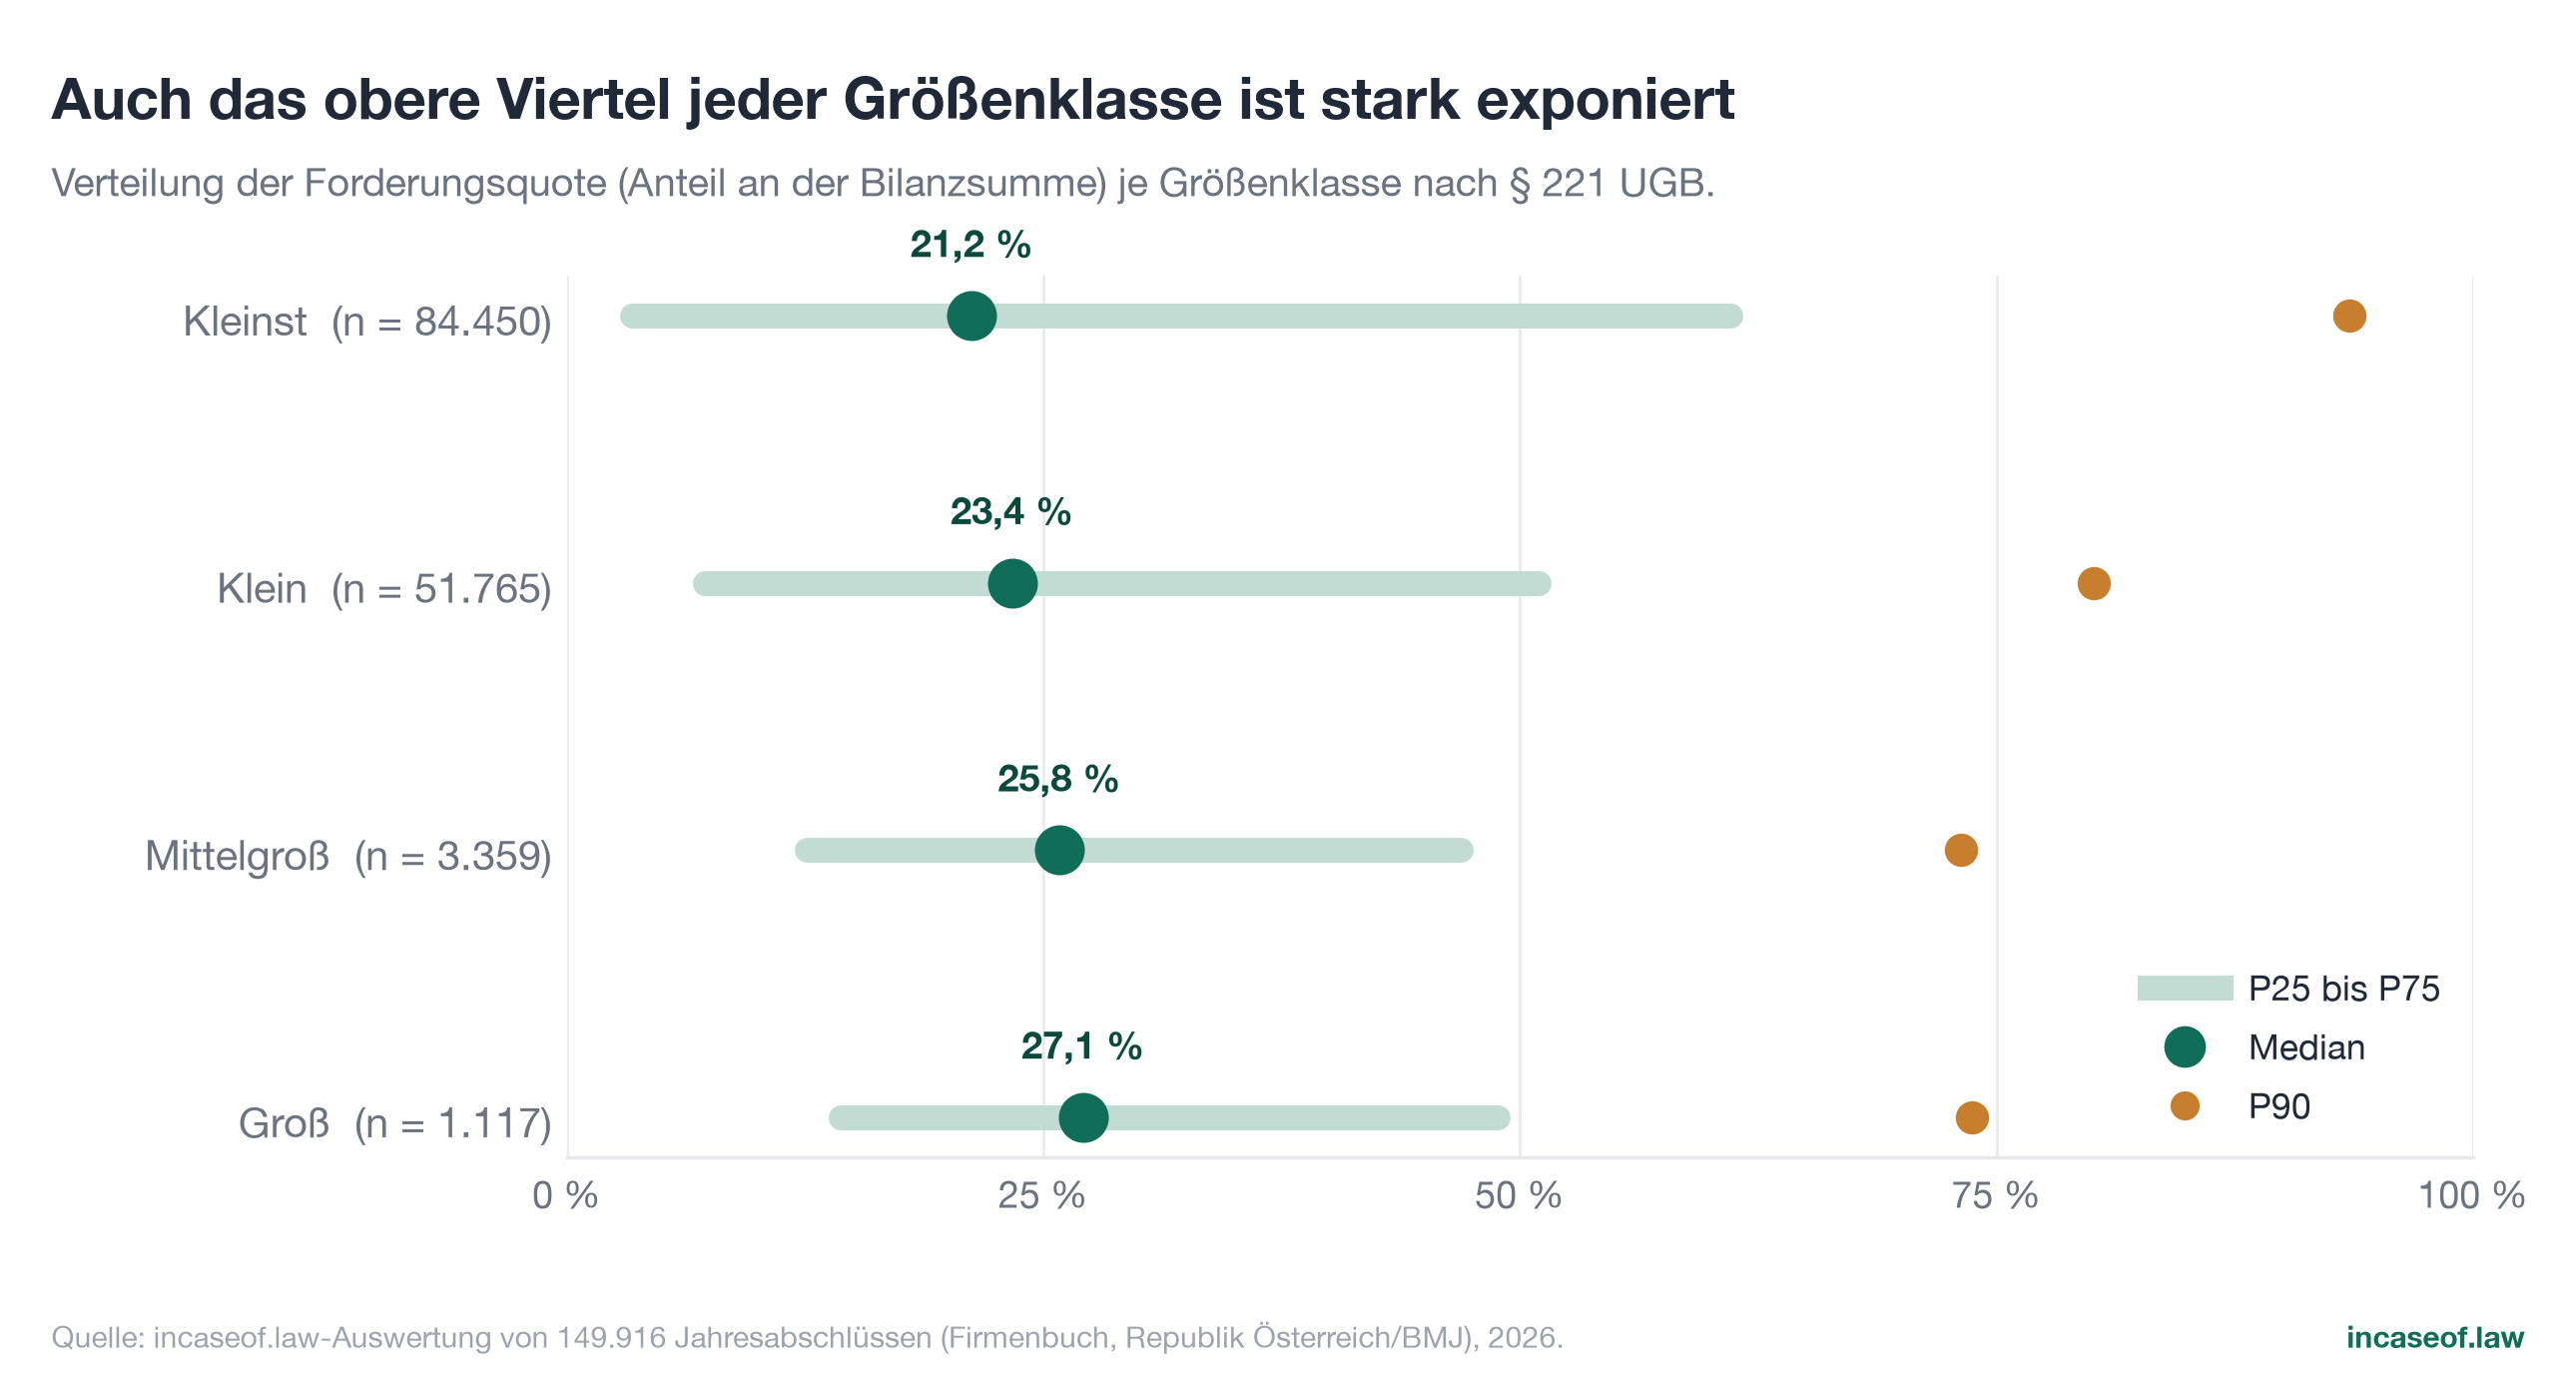
The median receivables ratio is 22.5 percent of total assets, the mean 33.4 percent (Figure 2). A difference of almost eleven percentage points between the two measures of location is a classic signal of a strongly right-skewed distribution: the mass of companies lies clearly below the average, while a minority with very high ratios pulls the mean upwards.
The percentiles trace this precisely: a quarter of companies reach at most a 5.0 percent receivables ratio, half at most 22.5 percent. At the upper edge, the picture tips: the top quarter lies above 56.2 percent, every tenth company above 89.1 percent, every twentieth above 98.5 percent. These extreme values are predominantly entities whose balance sheet consists almost entirely of receivables, typically holding, financing and settlement companies with intra-group positions. That too is tied-up capital, but of a different nature from the trade receivable of a craft business; the study therefore always reports distributions in full instead of reporting averages only.
| Percentile | P10 | P25 | P50 (median) | P75 | P90 | P95 |
|---|---|---|---|---|---|---|
| Receivables ratio | 0.5% | 5.0% | 22.5% | 56.2% | 89.1% | 98.5% |
Table: percentiles of the receivables ratio, n = 149,265 companies with a calculable ratio.
5.3 The distribution in detail
Grouping companies by receivables ratio classes reveals a twin-peaked landscape (Figure 3): 34.0 percent of companies hold receivables of less than 10 percent of total assets; at the other end, for 13.8 percent of companies more than 80 percent of the balance sheet consists of item B.II.
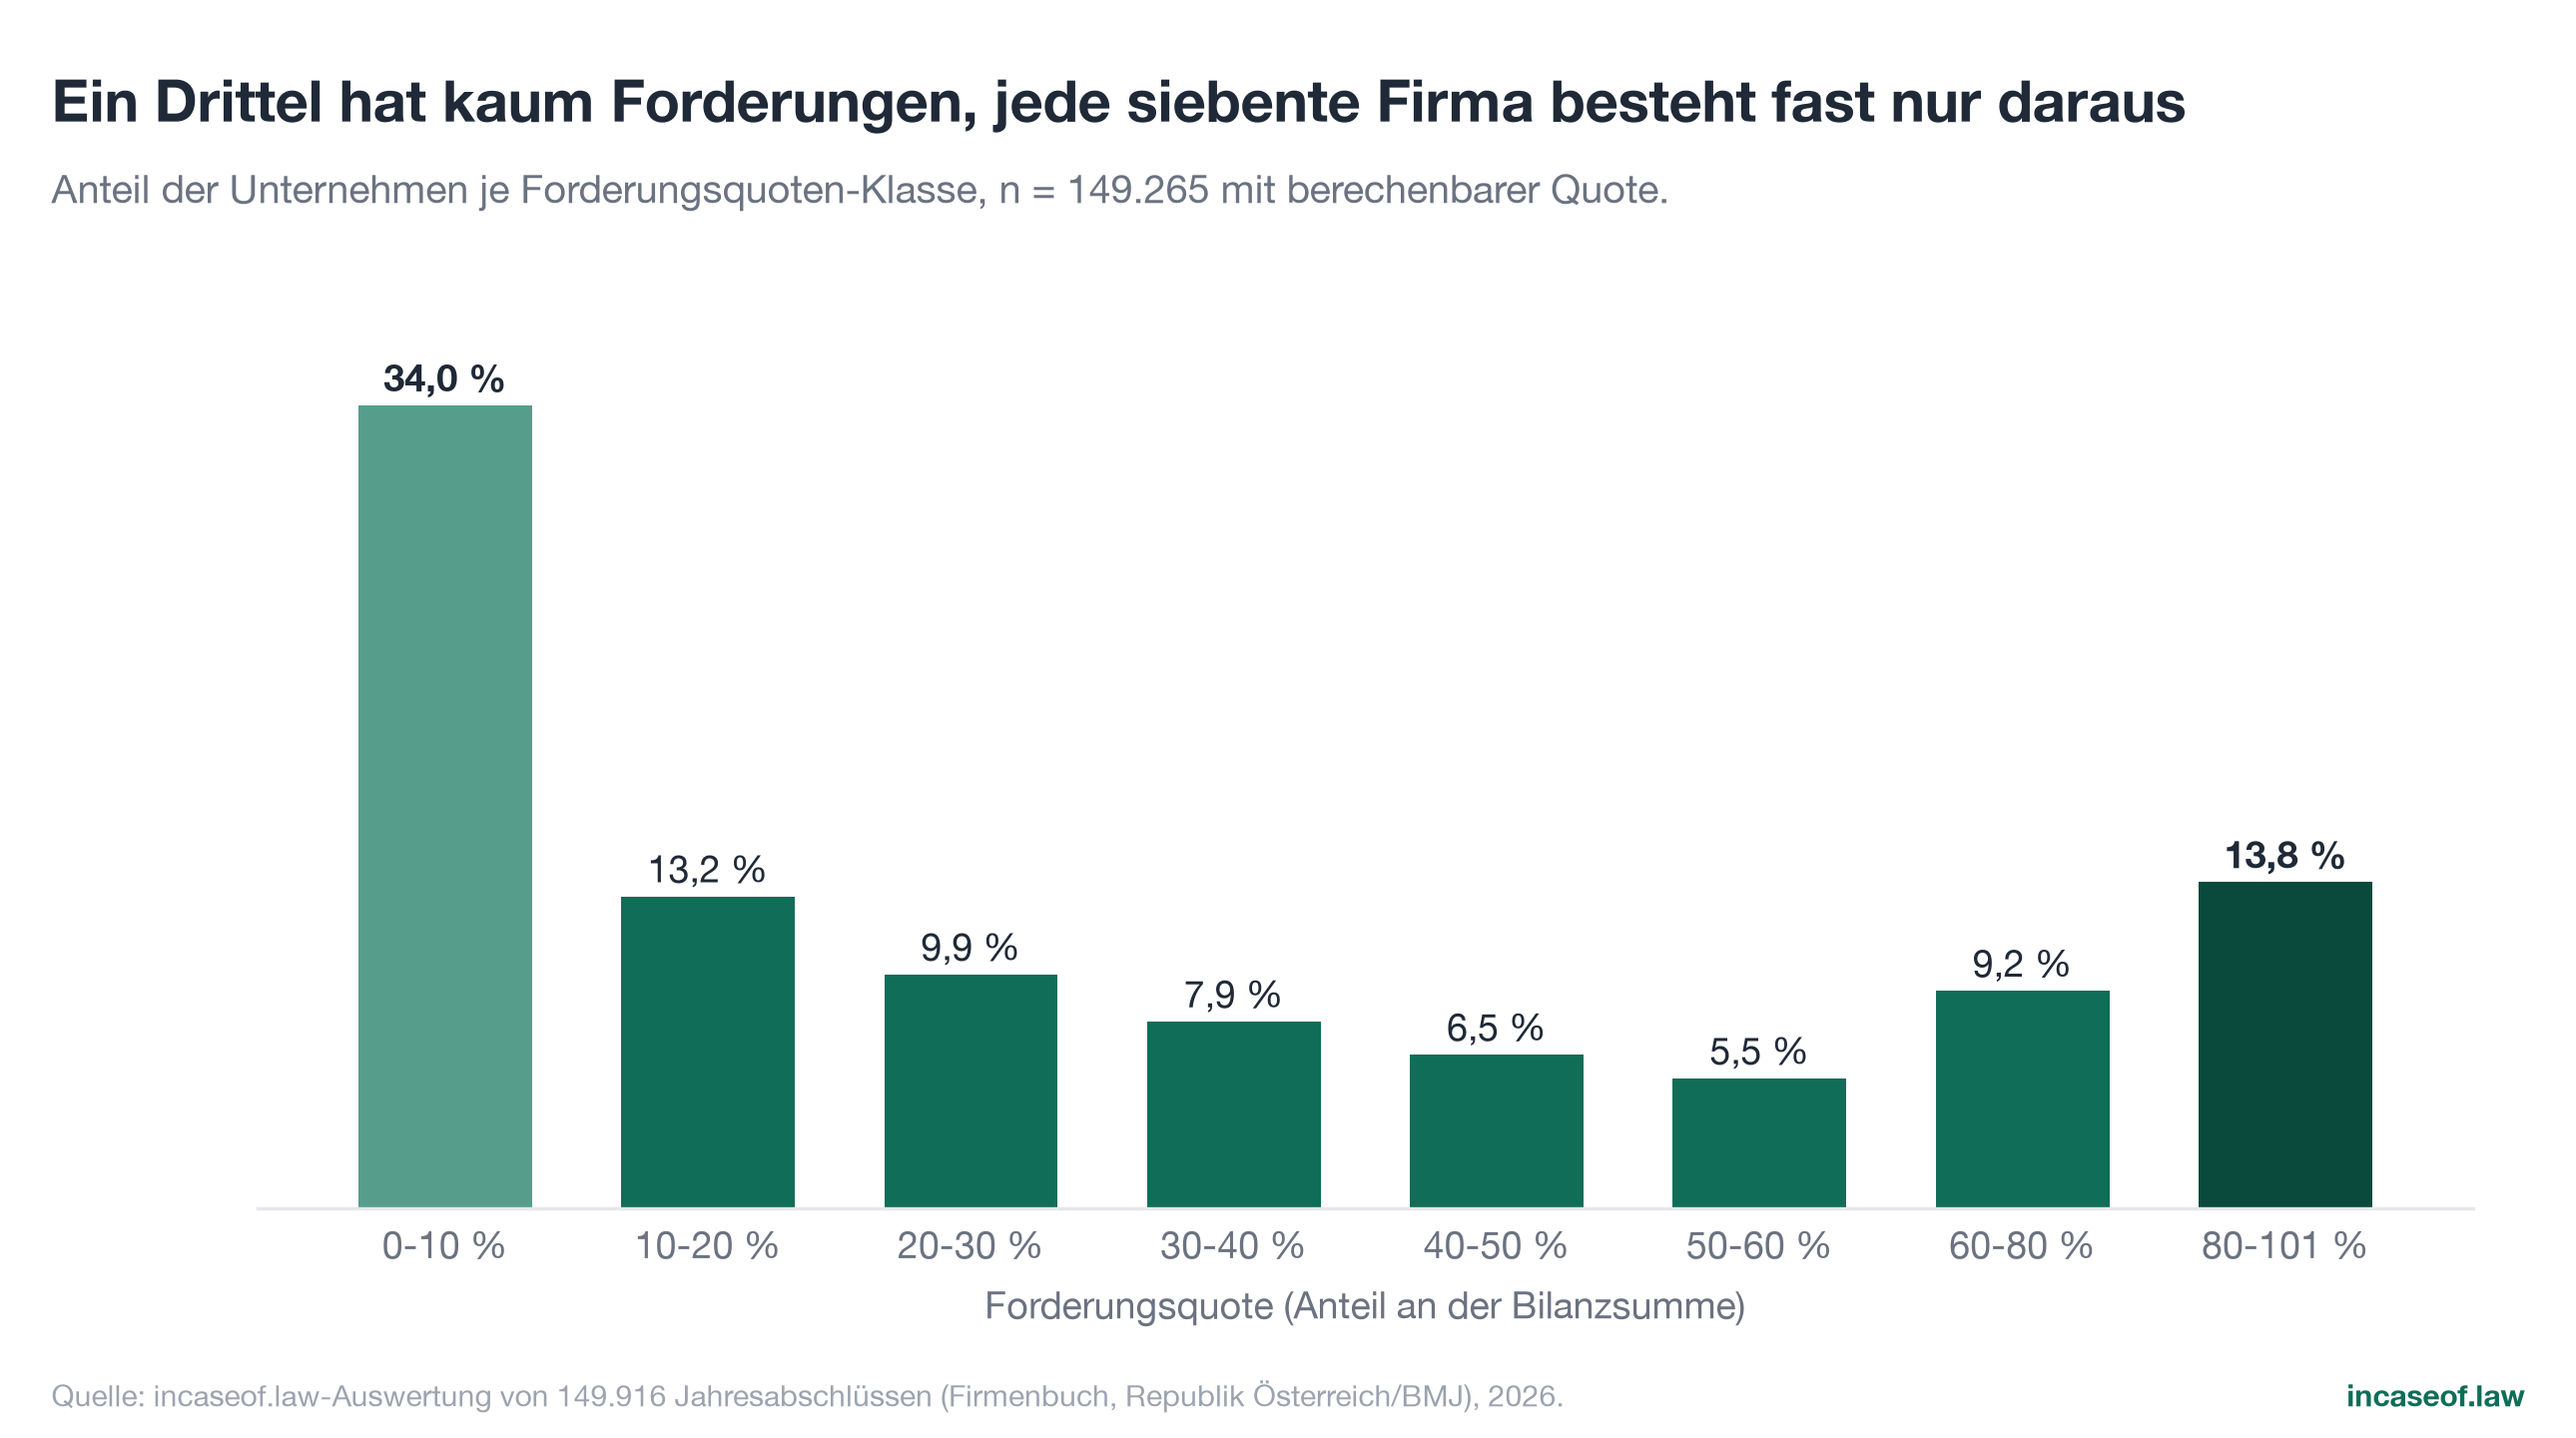
Weighted by volume, the picture shifts markedly: the class with ratios above 80 percent holds the largest share of the total receivables volume at 25.2 percent, although it comprises only every seventh company. The lowest class (below 10 percent) accounts for only 6.7 percent of the volume despite covering a third of all companies. Austria's tied-up capital is therefore concentrated not only in a few companies (Chapter 7), but also in balance sheet profiles in which receivables are the dominant type of asset.
| Receivables ratio | Share of companies | Share of volume |
|---|---|---|
| 0 to 10% | 34.0% | 6.7% |
| 10 to 20% | 13.2% | 12.3% |
| 20 to 30% | 9.9% | 12.4% |
| 30 to 40% | 7.9% | 11.4% |
| 40 to 50% | 6.5% | 9.7% |
| 50 to 60% | 5.5% | 9.7% |
| 60 to 80% | 9.2% | 12.7% |
| 80 to 101% | 13.8% | 25.2% |
Table: companies and receivables volume by ratio class (n = 149,265).
5.4 Interim conclusion
The overall picture refutes two widespread simplifications. First, the assumption that receivables are a marginal item: with a fifth of the aggregate balance sheet total and 38 percent of GDP, the item is macroeconomically significant. Second, the assumption that "the Austrian economy" has a particular receivables ratio: between the receivables-poor third and the receivables-dominated balance sheets lies a spectrum that systematically distorts average values. Any serious statement about the receivables landscape must therefore name distributions, not just means.
6. Size classes: from the micro entity to the corporate group
6.1 Structure of the population
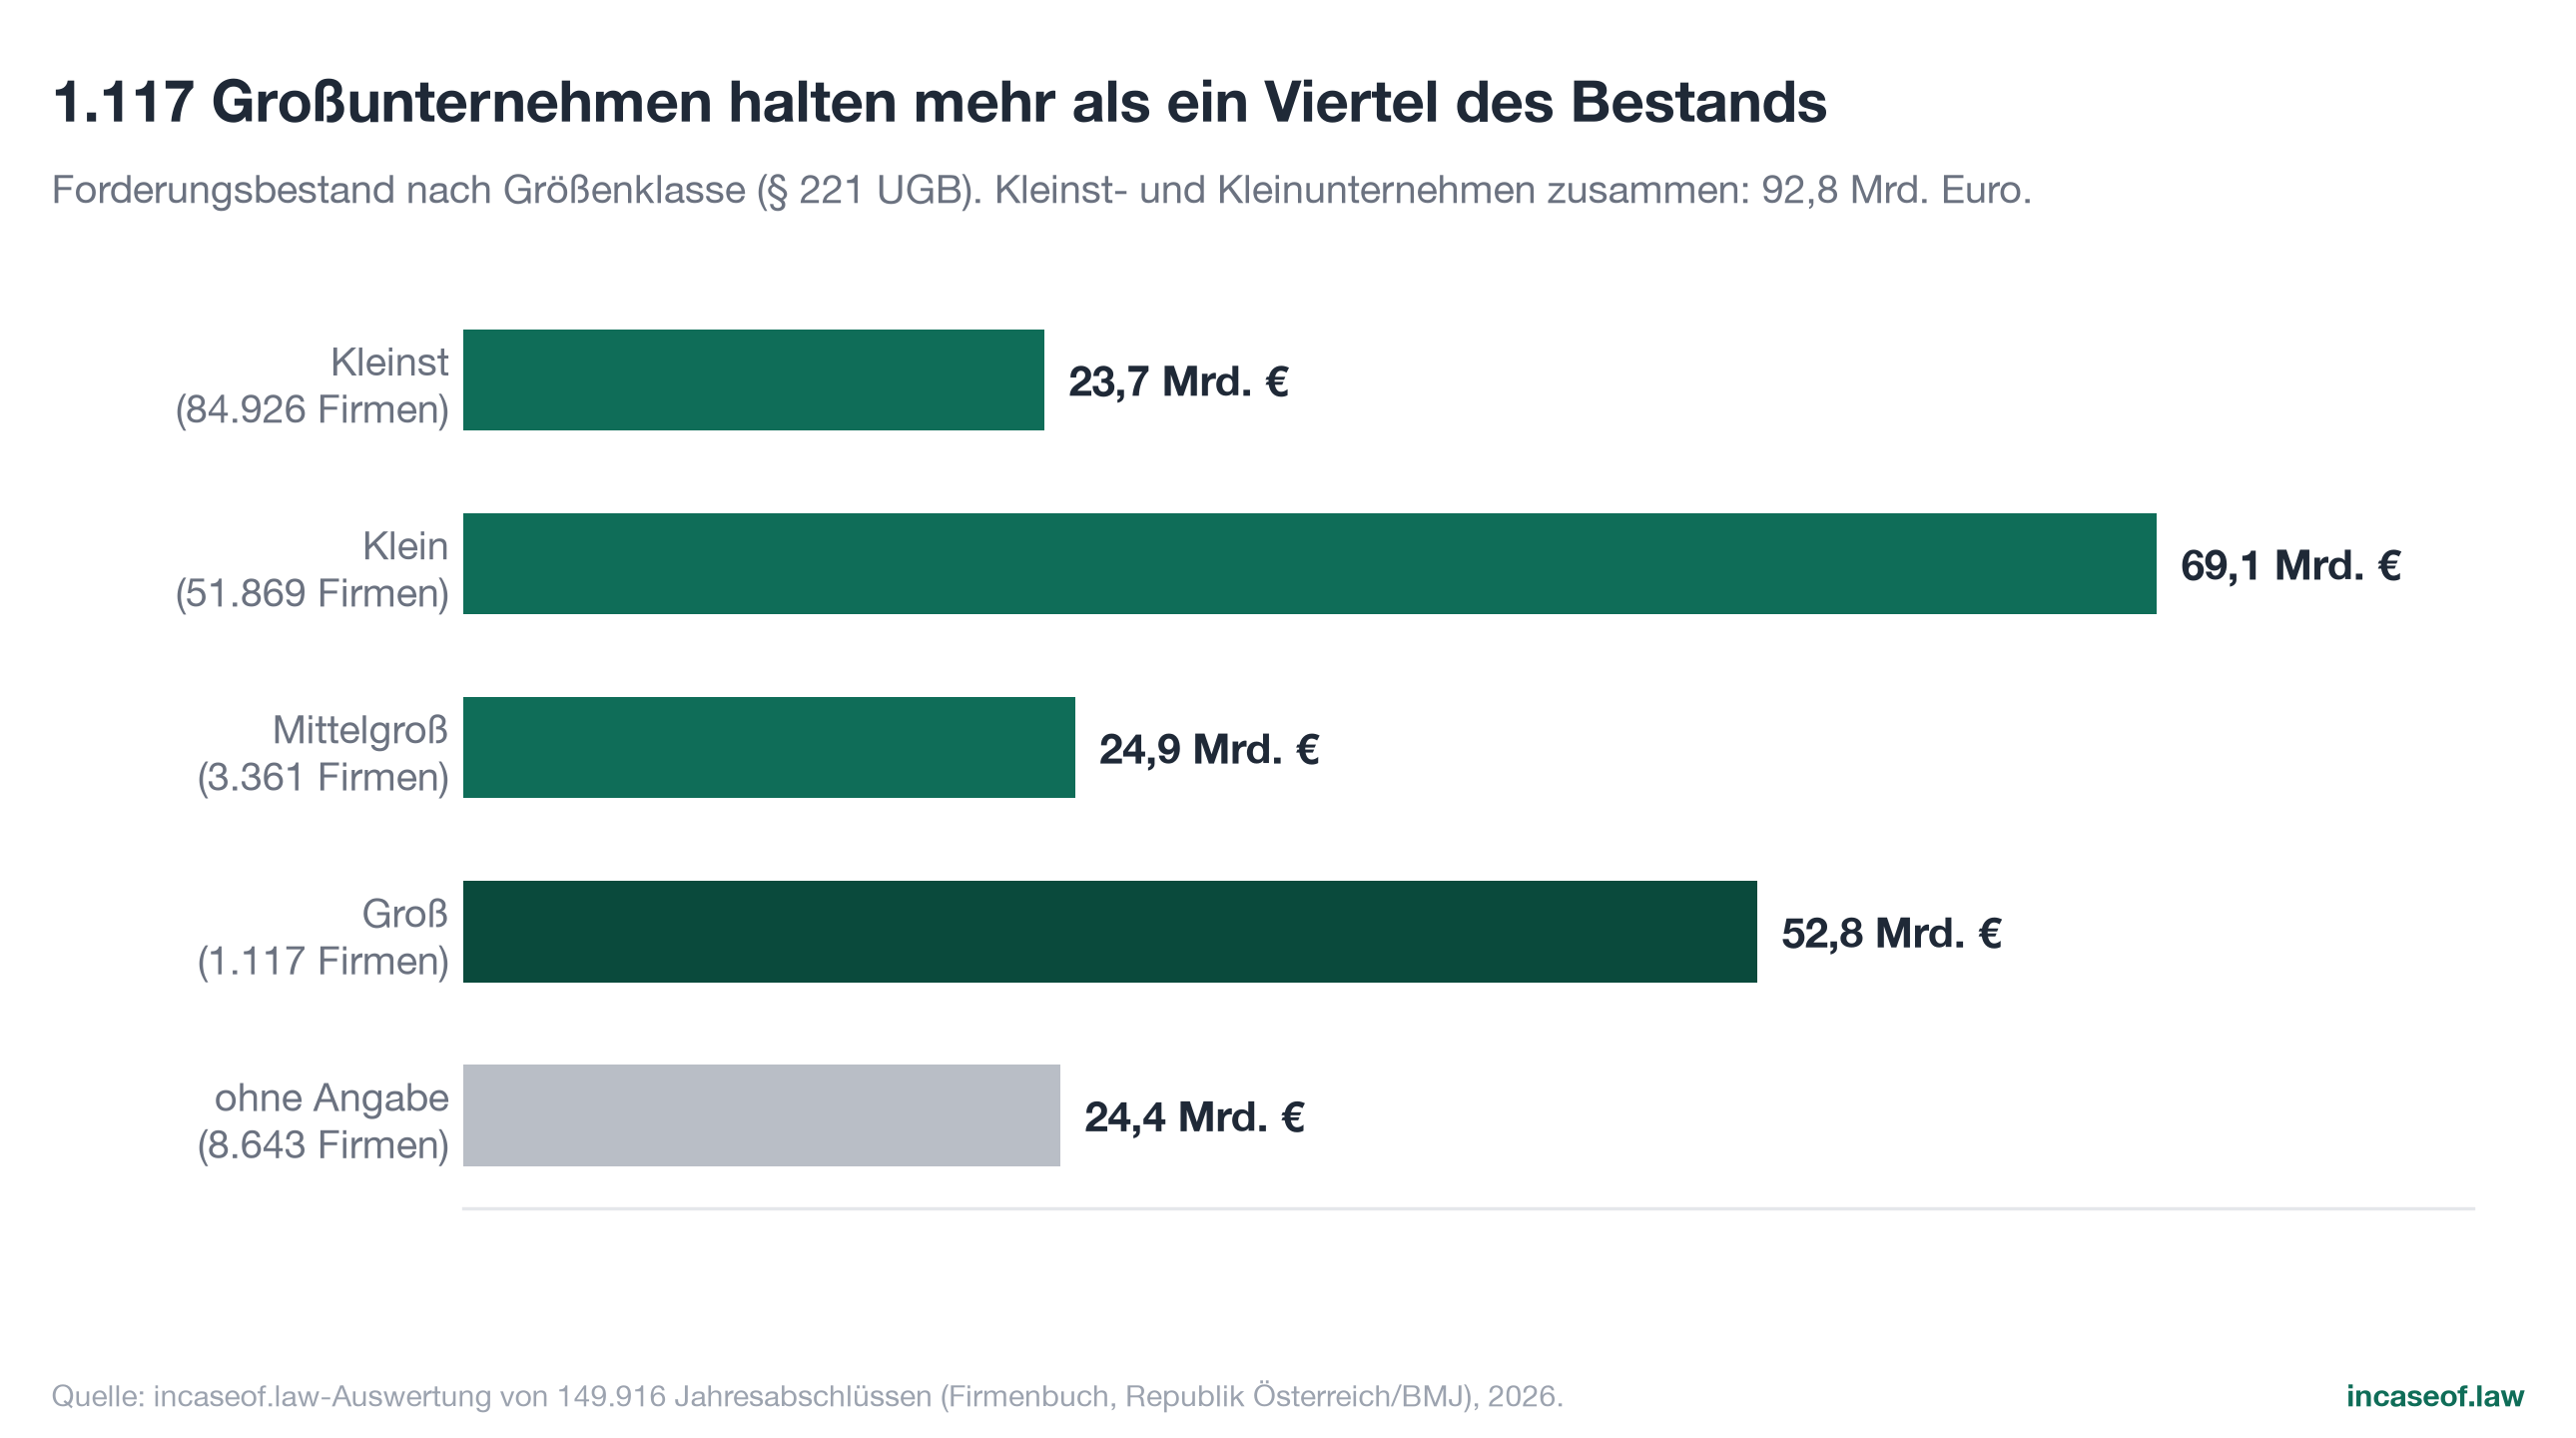
The size classes under Section 221 UGB break the population down as follows: 84,926 micro entities (56.6 percent), 51,869 small (34.6 percent), 3,361 medium-sized (2.2 percent) and 1,117 large entities (0.7 percent); for 8,643 entities (5.8 percent) the accounts contain no structured size class information (predominantly older filing formats). The distribution confirms the known structure of the Austrian corporate landscape: more than nine out of ten entities subject to disclosure requirements are micro or small businesses.
| Size class | Companies | Median ratio | Mean | Total receivables | Equity negative | Cash < 25% of receiv. | Median YoY | Median stock |
|---|---|---|---|---|---|---|---|---|
| Micro | 84,926 | 21.3% | 34.2% | 23.7bn € | 27.9% | 45.3% | +2.4% | 33,218 € |
| Small | 51,869 | 23.4% | 32.1% | 69.1bn € | 13.0% | 44.1% | +1.4% | 253,676 € |
| Medium-sized | 3,361 | 25.8% | 32.7% | 25.0bn € | 3.2% | 45.7% | -0.9% | 3.24m € |
| Large | 1,117 | 27.1% | 34.0% | 52.8bn € | 2.0% | 58.1% | +1.4% | 18.32m € |
| Not stated | 8,643 | 23.2% | 34.3% | 24.4bn € | 21.8% | 46.8% | +2.2% | 69,969 € |
| All | 149,916 | 22.5% | 33.4% | 194.9bn € | 21.6% | 45.1% | +1.9% | 77,875 € |
Table: key figures by size class (Section 221 UGB); the cash share relates to companies holding receivables, the year-on-year figure to companies with a prior-year value.
6.2 The ratio rises with size, the risk does not fall with it everywhere
What stands out first is the gradient of the median receivables ratio: it rises from 21.3 percent at micro entities through 23.4 percent at small and 25.8 percent at medium-sized to 27.1 percent at large entities. Larger companies therefore typically work with relatively more tied-up capital, plausibly explained by higher B2B shares, longer contractual payment terms and stronger group interlinkage. At the same time, micro entities are the most widely spread: their upper quarter already lies above 61.0 percent, and every tenth micro entity above 93.5 percent (Figure 4). The means, by contrast, lie close together across all classes (32 to 34 percent), further evidence that averages flatten out the differences between the classes.
6.3 Where the volume sits
The volume is distributed in the opposite direction from the head count (Figure 5): the 1,117 large entities hold more than a quarter (27.1 percent) of the entire stock at 52.8 billion euros, the 3,361 medium-sized entities a further 25.0 billion euros. Micro and small businesses together reach 92.8 billion euros (47.6 percent), spread across 136,795 entities. The median stock illustrates the range: 33,218 euros at the typical micro entity against 18.3 million euros at the typical large company, a factor of more than 550.
6.4 Interpretation
For risk analysis, this leads to a twofold reading. On the volume side, a few large entities dominate; disruptions at individual large debtors or in intra-group settlement structures move amounts in the billions. On the breadth side, tens of thousands of micro entities carry receivables that look small in the individual case but are existential in relation to their buffers: it is exactly in this class that negative equity is most widespread, at 27.9 percent (Chapter 8), and the spread of ratios is greatest. The Austrian receivables landscape therefore does not have one risk profile but two, and both deserve separate attention.
7. Concentration: a few hold almost everything
7.1 Lorenz curve and Gini coefficient
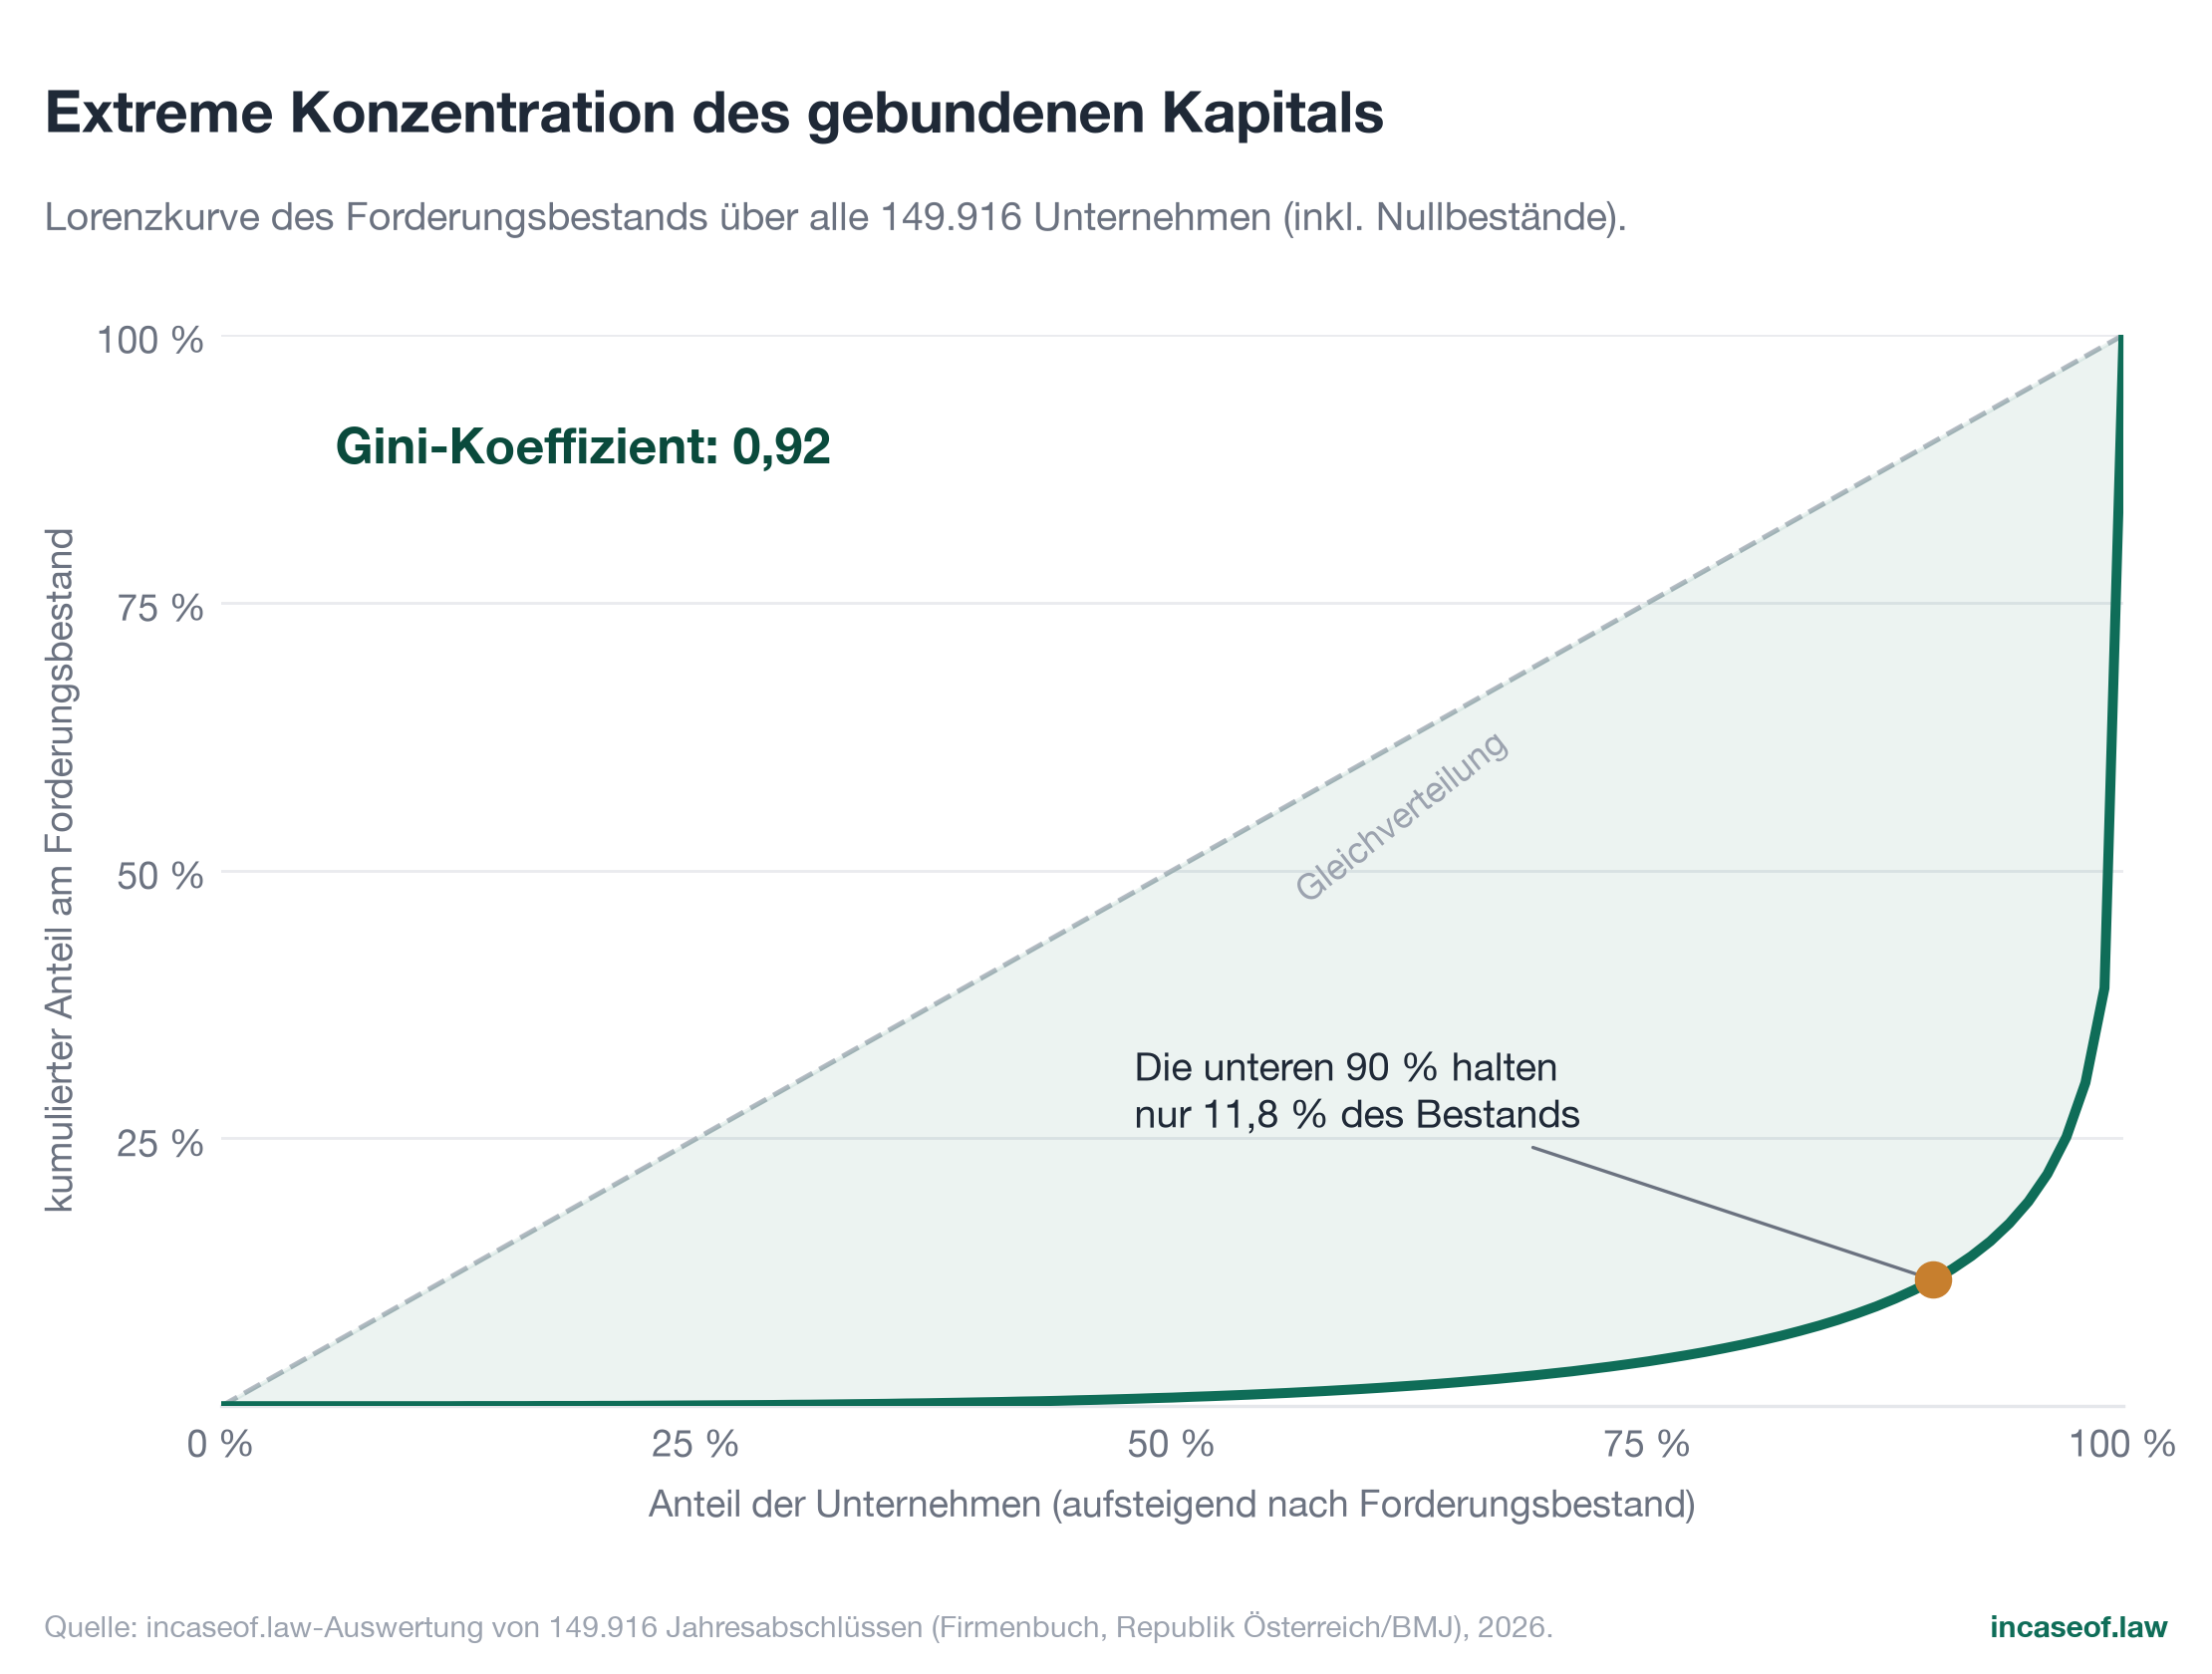
How unequally is the tied-up capital distributed across companies? The answer is one of the most striking figures in this study: the Gini coefficient of the receivables distribution is 0.92 (0 = perfect equality, 1 = maximum concentration; calculated across all 149,916 companies including those without any receivables). The Lorenz curve (Figure 6) runs correspondingly extreme: the bottom 90 percent of companies together account for only 11.8 percent of the stock of receivables.
7.2 The top of the distribution
In detail (Figure 7): the top 0.1 percent (150 entities) hold 65.4 billion euros, or 33.6 percent of the entire stock; entry to this group requires reporting more than around 146 million euros of receivables. The top one percent (1,499 entities, entry threshold around 16.5 million euros) holds 118.8 billion euros, or 61.0 percent. The top ten percent (14,992 entities, threshold around 1.26 million euros) account for 88.2 percent of the volume.
| Group | Companies | Entry threshold | Volume | Share of stock |
|---|---|---|---|---|
| Top 0.1% | 150 | approx. 146m € | 65.4bn € | 33.6% |
| Top 1% | 1,499 | approx. 16.5m € | 118.8bn € | 61.0% |
| Top 5% | 7,496 | approx. 2.95m € | 157.7bn € | 80.9% |
| Top 10% | 14,992 | approx. 1.26m € | 172.0bn € | 88.2% |
Table: concentration of the stock of receivables (companies ranked in descending order by stock).
Grouped by absolute stock classes, the same picture emerges from the other side (Figure 8): 2,480 companies with receivables above 10 million euros, that is 1.7 percent of the population, hold 67.4 percent of all tied-up capital. 17,983 companies report at least one million euros (together 90.0 percent of the volume), 68,484 companies at least 100,000 euros (98.9 percent of the volume). At the lower end, 28,105 entities hold receivables of up to 10,000 euros and 6,000 entities exactly zero.
7.3 What the concentration means
The concentration has two consequences. First, for systemic stability: a substantial part of the Austrian stock of receivables hangs on the payment flows and settlement structures of a few thousand large entities, among them group financing and holding companies whose B.II positions represent intra-group loans. Disruptions in this segment (restructurings, group insolvencies, unwinding of cash pools) move a multiple of what the entire lower third of the corporate landscape holds in receivables.
Second, for the interpretation of averages: anyone who imagines the 194.9 billion euros spread evenly across all companies (1.30 million euros per entity) misses the reality of 90 percent of companies by orders of magnitude. Policy and market diagnoses of "payment morale" should therefore always distinguish between the volume phenomenon (driven by the top) and the breadth phenomenon (tens of thousands of small stocks with high relative importance for their owners). For the individual micro entity, the loss of a 30,000 euro receivable is more existential than the loss of 30 million is for a group.
8. Equity and receivables burden: the double exposure
8.1 Every fifth entity is under water on the balance sheet
32,437 of the 149,916 entities (21.6 percent) report negative equity in their most recent accounts. The pattern across size classes is steep (Figure 9): among micro entities the share is 27.9 percent, among small entities 13.0 percent, among medium-sized entities 3.2 percent and among large entities 2.0 percent. Negative equity is not the same as insolvency (what matters is the ability to pay and the going concern prognosis), but it does mean that losses have consumed the liable capital, that the entity is living on borrowed funds on the balance sheet, frequently on shareholder loans, and that it has no buffer for further losses.
8.2 The cross-tabulation: where risks stack up
Equity weakness becomes explosive in combination with a heavy receivables burden. The cross-tabulation of the equity ratio and the receivables ratio (n = 149,265 with both key figures; Figure 10) shows the map of these double risks:
| Equity ratio | Receiv. ratio below 10% | 10 to 25% | 25 to 50% | above 50% |
|---|---|---|---|---|
| negative | 13,170 | 4,884 | 4,859 | 9,139 |
| 0 to 10% | 5,463 | 2,160 | 1,783 | 2,788 |
| 10 to 30% | 6,598 | 4,017 | 4,143 | 5,415 |
| above 30% | 25,579 | 16,524 | 17,543 | 25,200 |
Table: companies per combination of equity ratio and receivables ratio.
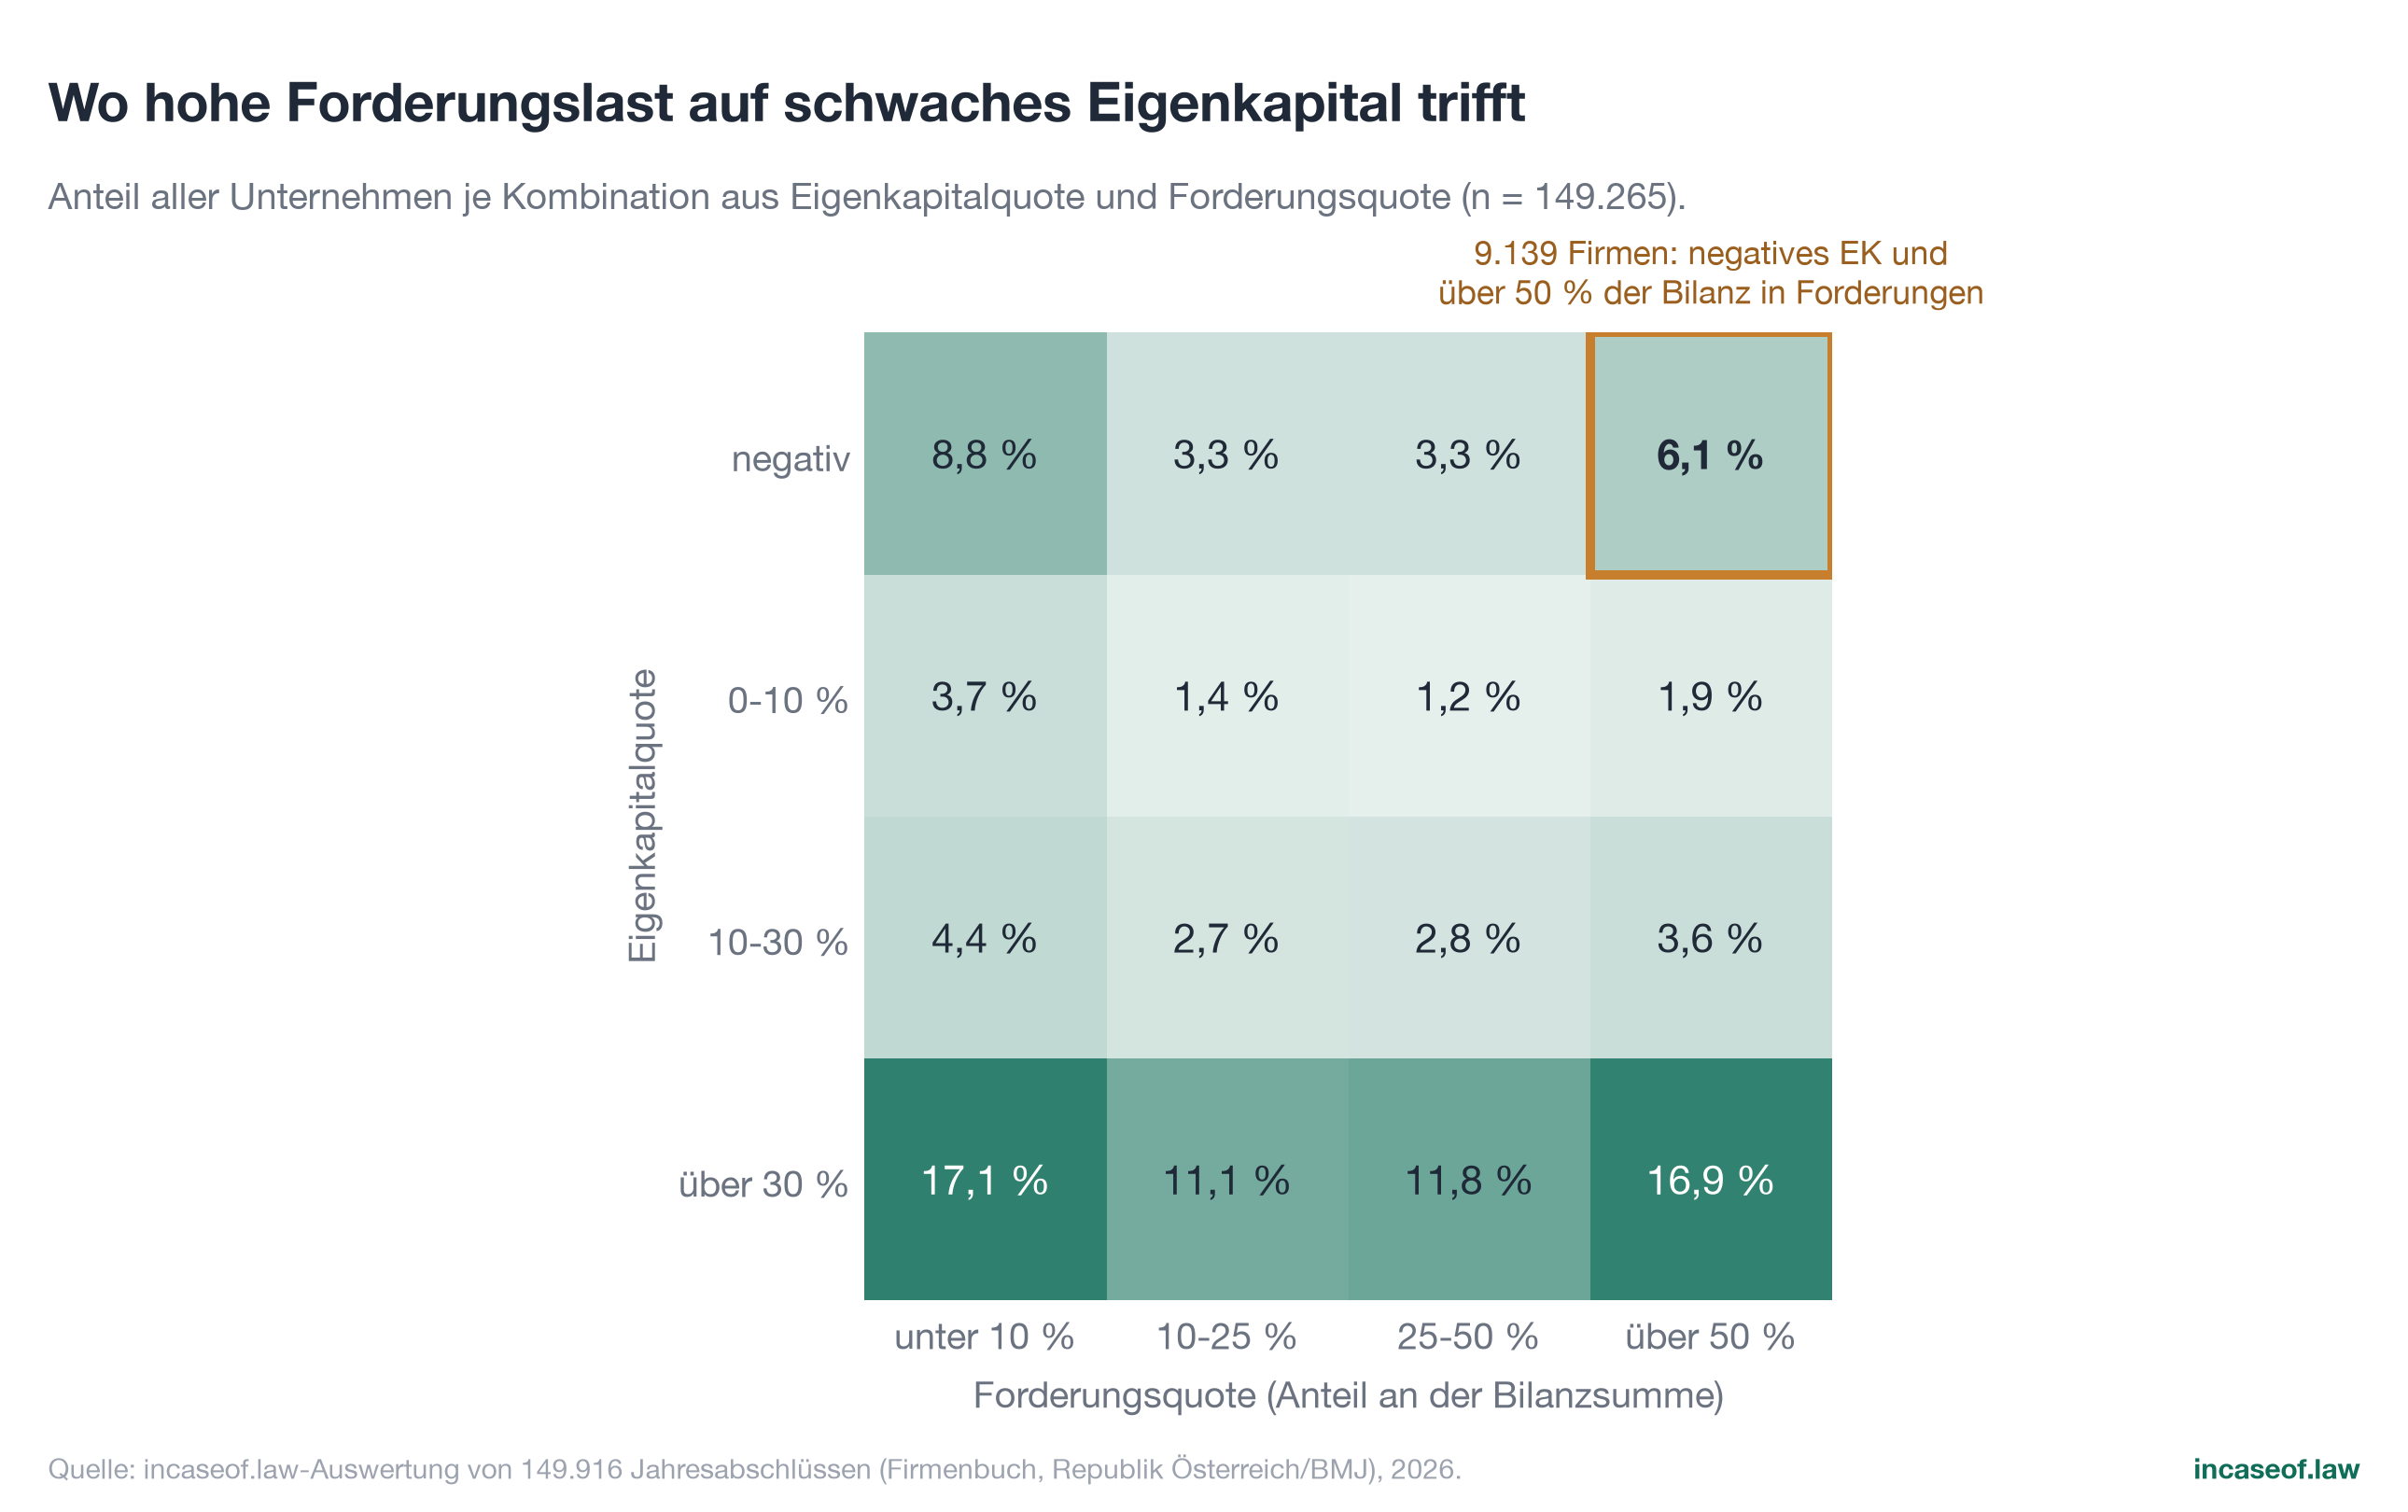
The most critical cell is at the top right: 9,139 entities (6.1 percent) combine negative equity with a receivables ratio above 50 percent. For these companies, the largest block of assets is at the same time the one they can least control themselves: whether the balance sheet works out is decided essentially by their debtors. If collection is delayed or a larger debtor fails, there is no equity cushion at all to absorb the blow. Here the chain from payment disruption to threat of existence is at its shortest.
The counter-diagonal is also notable: a good sixth of companies (16.9 percent) combines comfortable equity (above 30 percent) with a high receivables ratio (above 50 percent). High stocks of receivables are therefore not a crisis indicator in themselves; they become one where the buffers are missing. Overall, for 45.9 percent of all entities the stock of receivables exceeds total equity: almost half of Austrian limited companies have more money sitting with their debtors than they own in equity.
8.3 Classification
The combination of the two key figures explains why the "pull effect" of insolvencies (KSV1870, 2025) is structurally built into Austria: around a fifth of companies operate without an equity buffer, and a considerable part of them at the same time depend on third-party payments to an above-average degree. In an environment with 6,810 corporate insolvencies (2025) and 39 percent of proceedings not opened for lack of assets (KSV1870, 2026a), this combination is the transmission belt that turns individual losses into chains.
9. Liquidity coverage: how much cash stands behind the receivables?
9.1 The coverage relation
A simple, hard key figure describes vulnerability to payment disruptions: the ratio of cash on hand and bank balances to the stock of receivables. It answers the question of what part of its open positions a company could bridge out of its own liquidity if payments fail to arrive. Of the 143,542 companies holding receivables, 45.1 percent hold liquid funds of less than a quarter of that stock (measured against all 149,916 companies analysed: 43.2 percent). Median coverage is 36.4 percent; for almost two thirds (65.4 percent) the receivables exceed the liquid funds.
9.2 Polarisation instead of a middle
The distribution is remarkably split in two (Figure 11): 34.8 percent of companies do not even reach 10 percent cash coverage, while 34.7 percent are above 100 percent and therefore hold more liquidity than receivables. The middle is thinly populated. In terms of liquidity, Austria's corporate landscape falls into two similarly sized camps: a third with a comfortable cushion and a third for which even moderate collection delays immediately become a financing issue.
| Cash coverage | Share of companies |
|---|---|
| below 10% | 34.8% |
| 10 to 25% | 10.2% |
| 25 to 50% | 9.6% |
| 50 to 100% | 10.7% |
| 100% and above | 34.7% |
Table: distribution of cash coverage (cash on hand and bank balances as a percentage of the stock of receivables), n = 143,542.
9.3 The size pattern: cash pooling inverts the intuition
One would expect large companies to show the most comfortable coverage. The opposite is the case (Figure 12): the share of companies with coverage below 25 percent lies close together at micro (45.3 percent), small (44.1 percent) and medium-sized entities (45.7 percent), but jumps to 58.1 percent at large entities. The explanation lies in group financing: large entities often do not hold liquidity in their own accounts but pass it on to parent or financing companies through cash pooling; their liquidity reserve then appears precisely as an intra-group receivable in item B.II. That raises the stock of receivables and lowers the measured cash coverage at the same time.
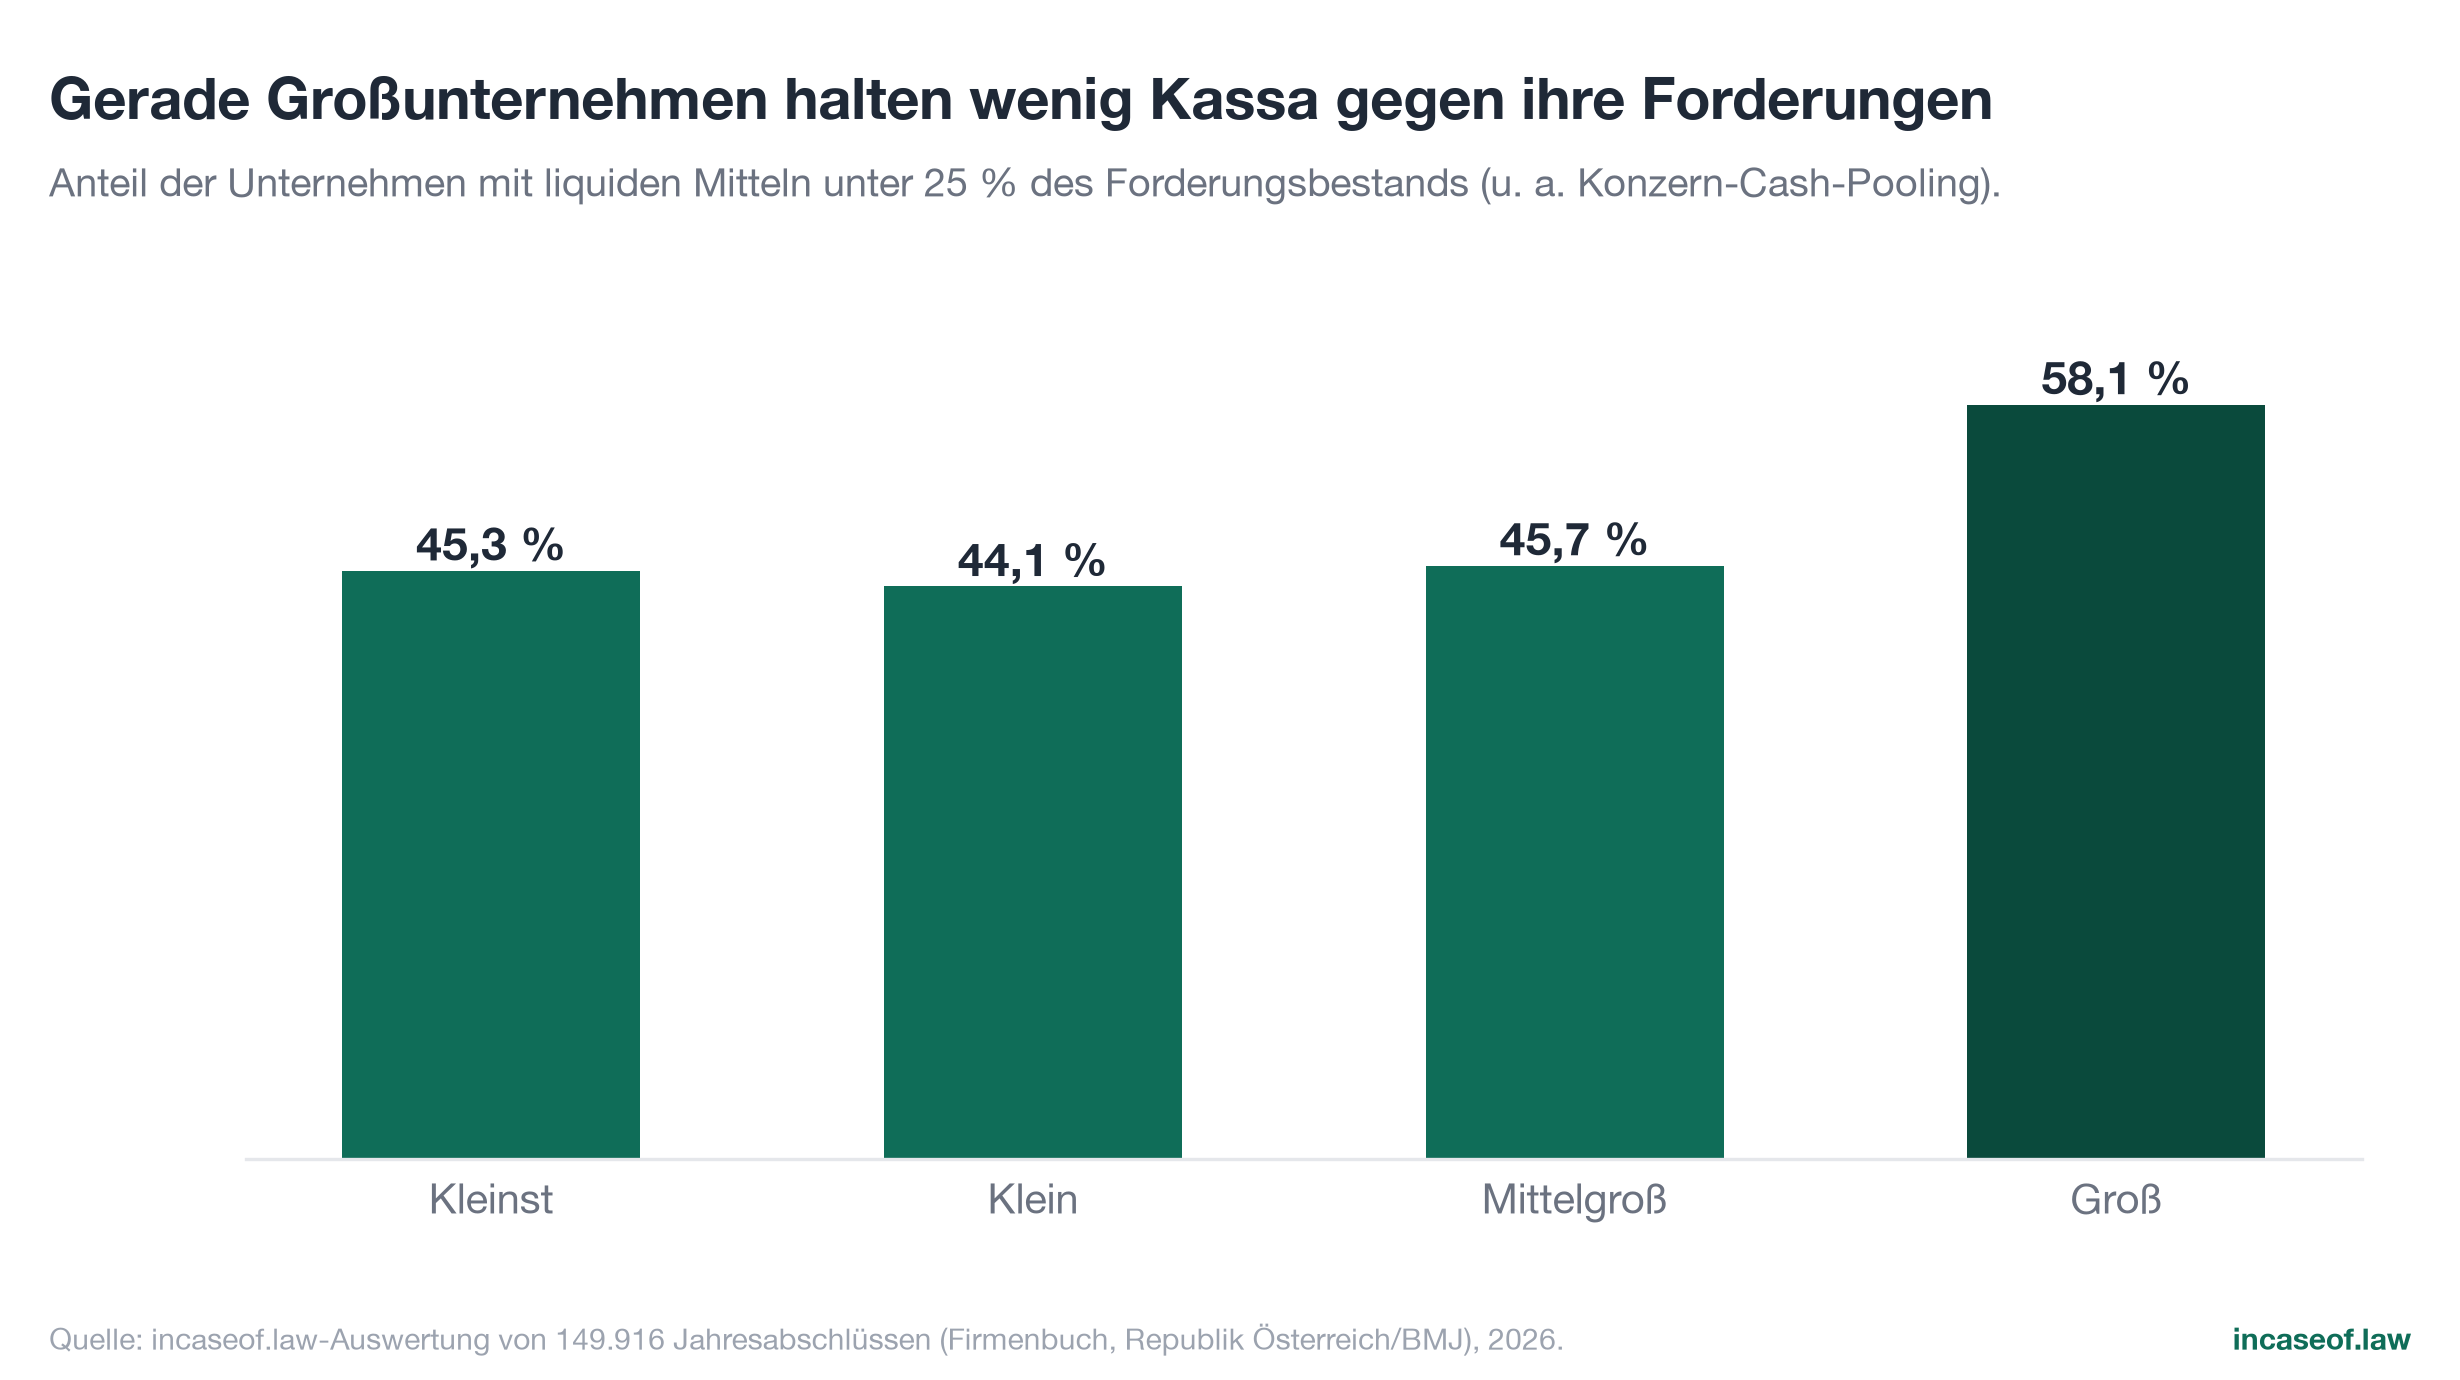
For interpretation this means two things. At large companies, low coverage is predominantly an expression of group structures, not of a liquidity emergency; it does show, however, how strongly the liquidity of even large units depends on intra-group promises to pay working properly. At micro and small businesses, which as a rule do not use cash pooling, the coverage ratio by contrast is a direct measure of hardness: around 45 percent of them could not replace even a quarter of their open receivables out of their own cash.
9.4 Aggregate coverage
At the aggregate level too, the relation remains tight: the 194.9 billion euros of receivables are matched by 65.6 billion euros of liquid funds, a coverage of 33.7 percent. Taken as a whole, the Austrian corporate landscape has around three times more money sitting with its debtors than in its own cash. This relation is the balance sheet core of what this study calls tied-up capital: assets whose availability depends on the payment discipline of others.
10. Dynamics: year-on-year, reporting dates and long-term commitment
10.1 The stock keeps growing
Every set of accounts analysed contains the prior-year value of item B.II; for 130,873 companies a positive prior-year value is available. On this basis, a continued upward drift emerges: the stock of receivables rose by a median of 1.9 percent year on year; 52.9 percent of companies expanded their stock. The dynamics are considerably more spread out than the moderate median suggests (Figure 13): 30.7 percent of companies recorded an increase of more than 25 percent, 26.8 percent a decrease of more than 25 percent. Stocks of receivables are highly volatile at the level of individual companies; project-driven business models, individual large orders or intra-group settlements can multiply or halve the item within a single year.
On the aggregate basis adjusted for anomalies (plausibility rule under Chapter 2.4, n = 127,203), the total volume grew from 181.2 to 188.6 billion euros, a gain of 4.1 percent within one year, and that in an environment of practically stagnant real economic output (2025: plus 0.8 percent; WIFO, 2026). The stock of receivables is therefore growing noticeably faster than the economy: a growing share of value creation is being financed in the meantime by suppliers.
10.2 Balance sheet dates: a year-end snapshot
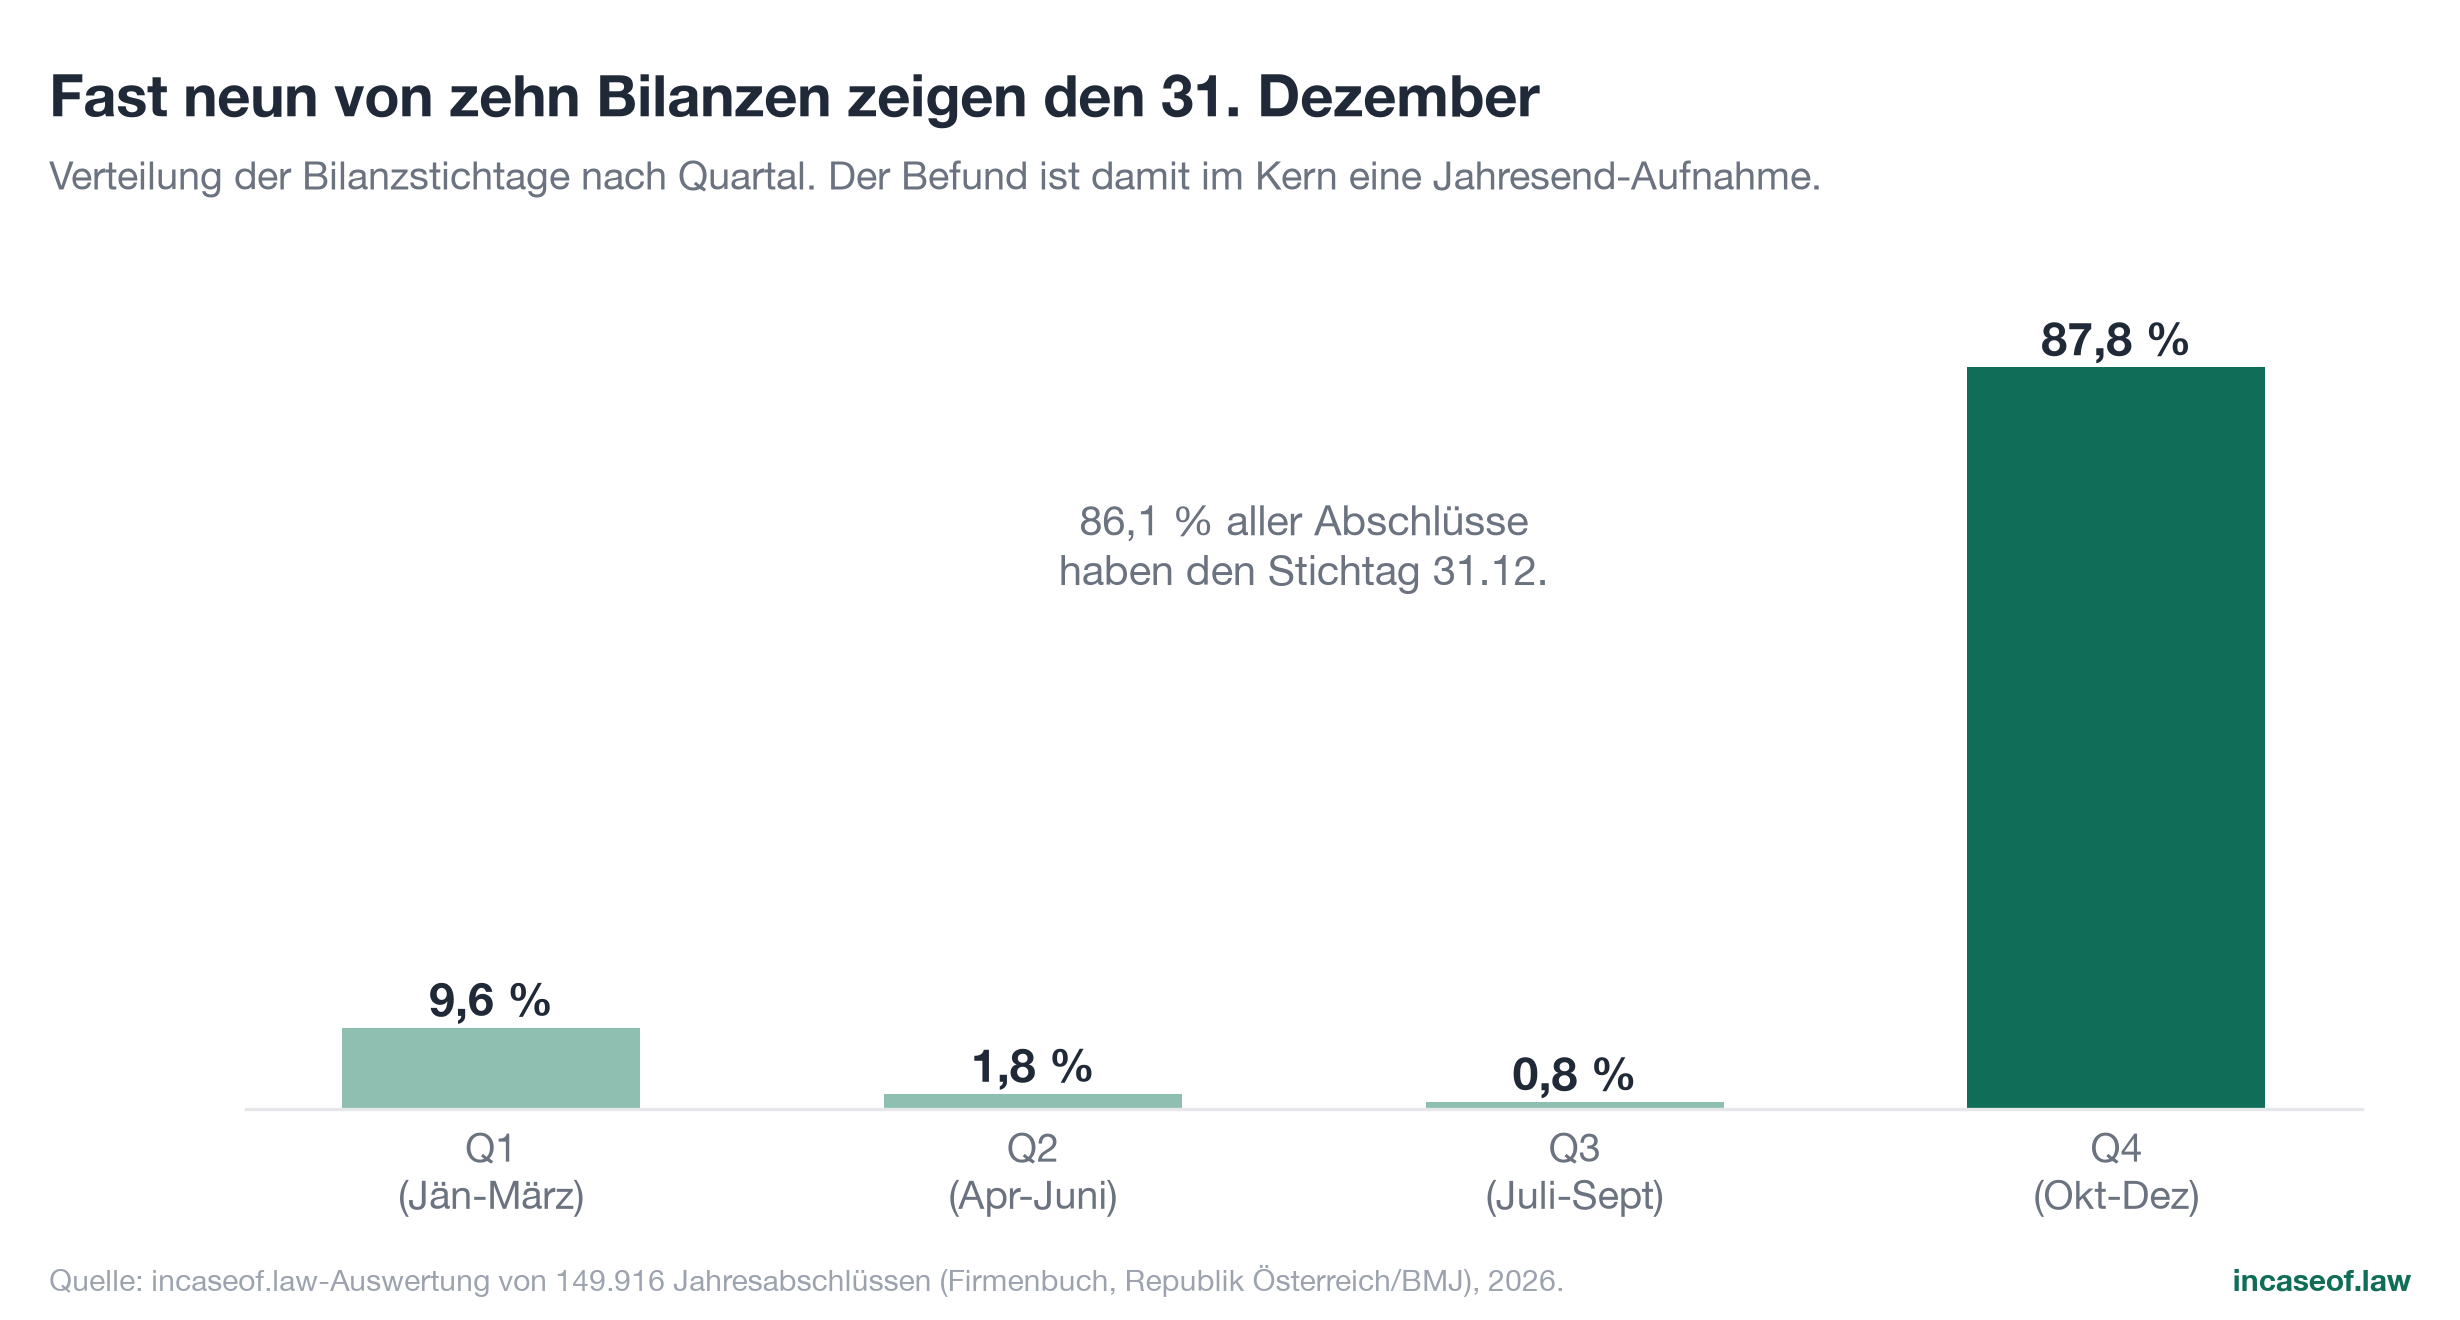
The structure of reporting dates is essential for classifying all stock figures (Figure 14): 87.8 percent of the accounts have their balance sheet date in the fourth quarter, 86.1 percent exactly on 31 December; 9.6 percent fall in the first, 1.8 percent in the second and 0.8 percent in the third quarter. The study therefore measures the receivables landscape essentially as at the year end, the point at which many companies close invoice runs and issue project accounts. The median receivables ratios of the reporting date cohorts lie in a moderate band from 19.5 percent (Q2) to 24.6 percent (Q3); because of the very different cohort sizes and sector compositions, these differences are to be read as descriptive, not as seasonality in the narrow sense.
10.3 Remaining term of more than one year: the long-term commitment
Since the format changeover to JAb 4.0 (mandatory since 1 January 2026), the statutory "of which" note under Section 225(3) UGB, the amount of receivables with a remaining term of more than one year, is machine-readable in structured form for the first time. Two clarifications up front: first, the remaining term denotes the time until the receivable falls due, not the age of the receivable; overdue invoices are already due and precisely do not appear here. Typical contents are rather shareholder and other loans, deposits and positions with a long-term deferral. Second, the note is available only for the JAb 4.0 sub-sample: the 2,001 companies in the population whose most recent accounts were already filed in the new format (predominantly early filers for the financial years 2025).
In this sub-sample, 238 companies (11.9 percent) report a remaining term amount above zero. The volume is substantial: 0.45 billion euros, or 12.3 percent of the sub-sample's stock of receivables (3.66 billion euros), falls due only after more than one year. At the companies concerned, the long-term part ties up a median of 36.2 percent of their entire stock of receivables; the median amount is around 56,000 euros (Figure 15).
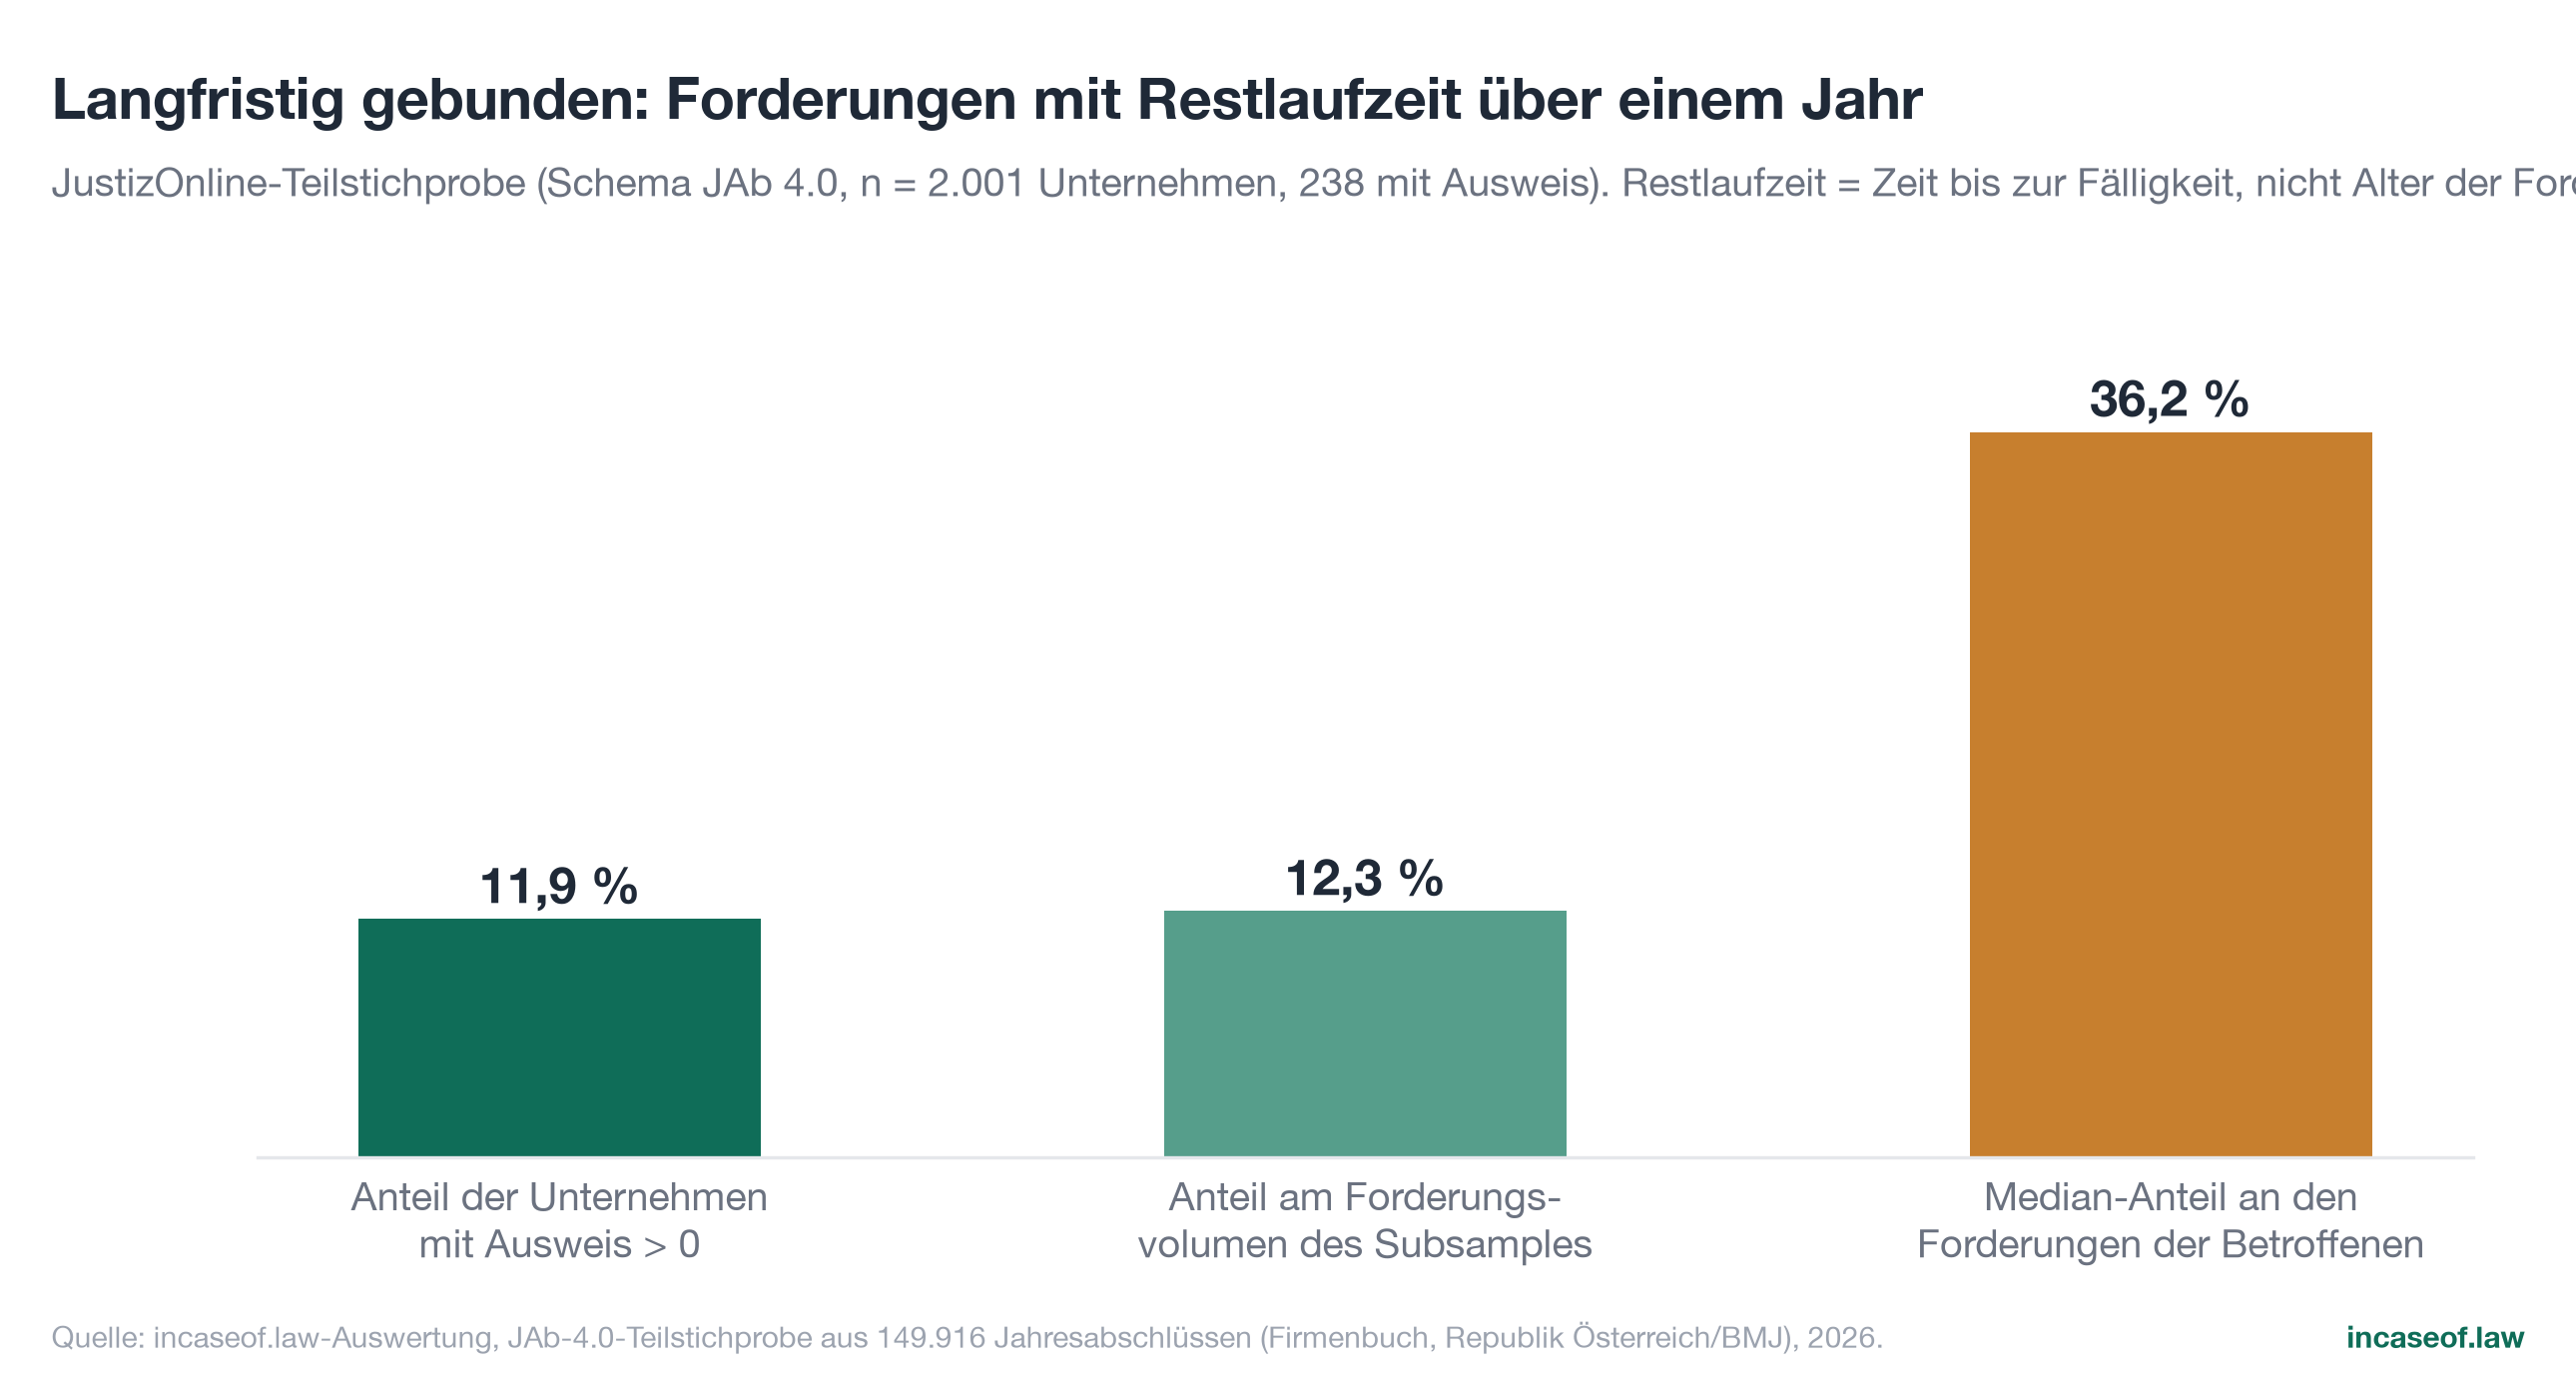
Extrapolated, this note will become a field of observation in its own right in the coming reporting years: if the ratio of the sub-sample is confirmed across the board, around every eighth company carries receivables that remain tied up for longer than a year as planned, on top of the unplanned commitment caused by late payment. The study deliberately refrains from extrapolating the volume to the whole population, since the sub-sample is selected by filing date (Chapter 14).
10.4 Receivables in days of revenue: the profit and loss sub-sample
For the 5,362 companies (3.6 percent) that disclose a profit and loss account (predominantly medium-sized and large entities), the stock of receivables can be set in relation to annual revenue. There, item B.II corresponds to a median of 232 days of revenue. This figure is expressly not a DSO (days sales outstanding): alongside trade receivables it contains intra-group and other positions and considerably overstates pure customer payment duration. Its message lies precisely in that: even at companies with strong revenues, the capital tied up in B.II in total exceeds the volume of more than seven monthly revenues. The item is therefore far more than a pass-through entry of invoicing; it is a structural financing block.
11. Austria in European comparison: payment behaviour under pressure
The register data show the stock; how the payment flow behind it is doing is documented by two established European surveys: the Payment Practices Barometer by Atradius (survey of Austrian companies, June 2026 edition) and the European Payment Report by Intrum (survey of 8,385 executives in 20 countries, April 2026 edition, with its own Austrian edition).
11.1 High exposure despite short payment terms
Austria is not a country of lax payment terms: most suppliers keep their payment periods within a 30-day window, stricter than in the Western European environment, and 48 percent of B2B revenue is sold on credit (Atradius, 2026). All the more striking is how disruption-prone the incoming payments are: 84 percent of Austrian companies report being affected by late B2B payments, against 77 percent in Western Europe (Atradius, 2026). A larger share than the Western European average, above all in trade, also reports delays on 20 to 40 percent of B2B invoices (Atradius, 2026). Austria therefore combines short formal terms with above-average real exposure to late payment; the problem lies not in contract design, but in payment behaviour.
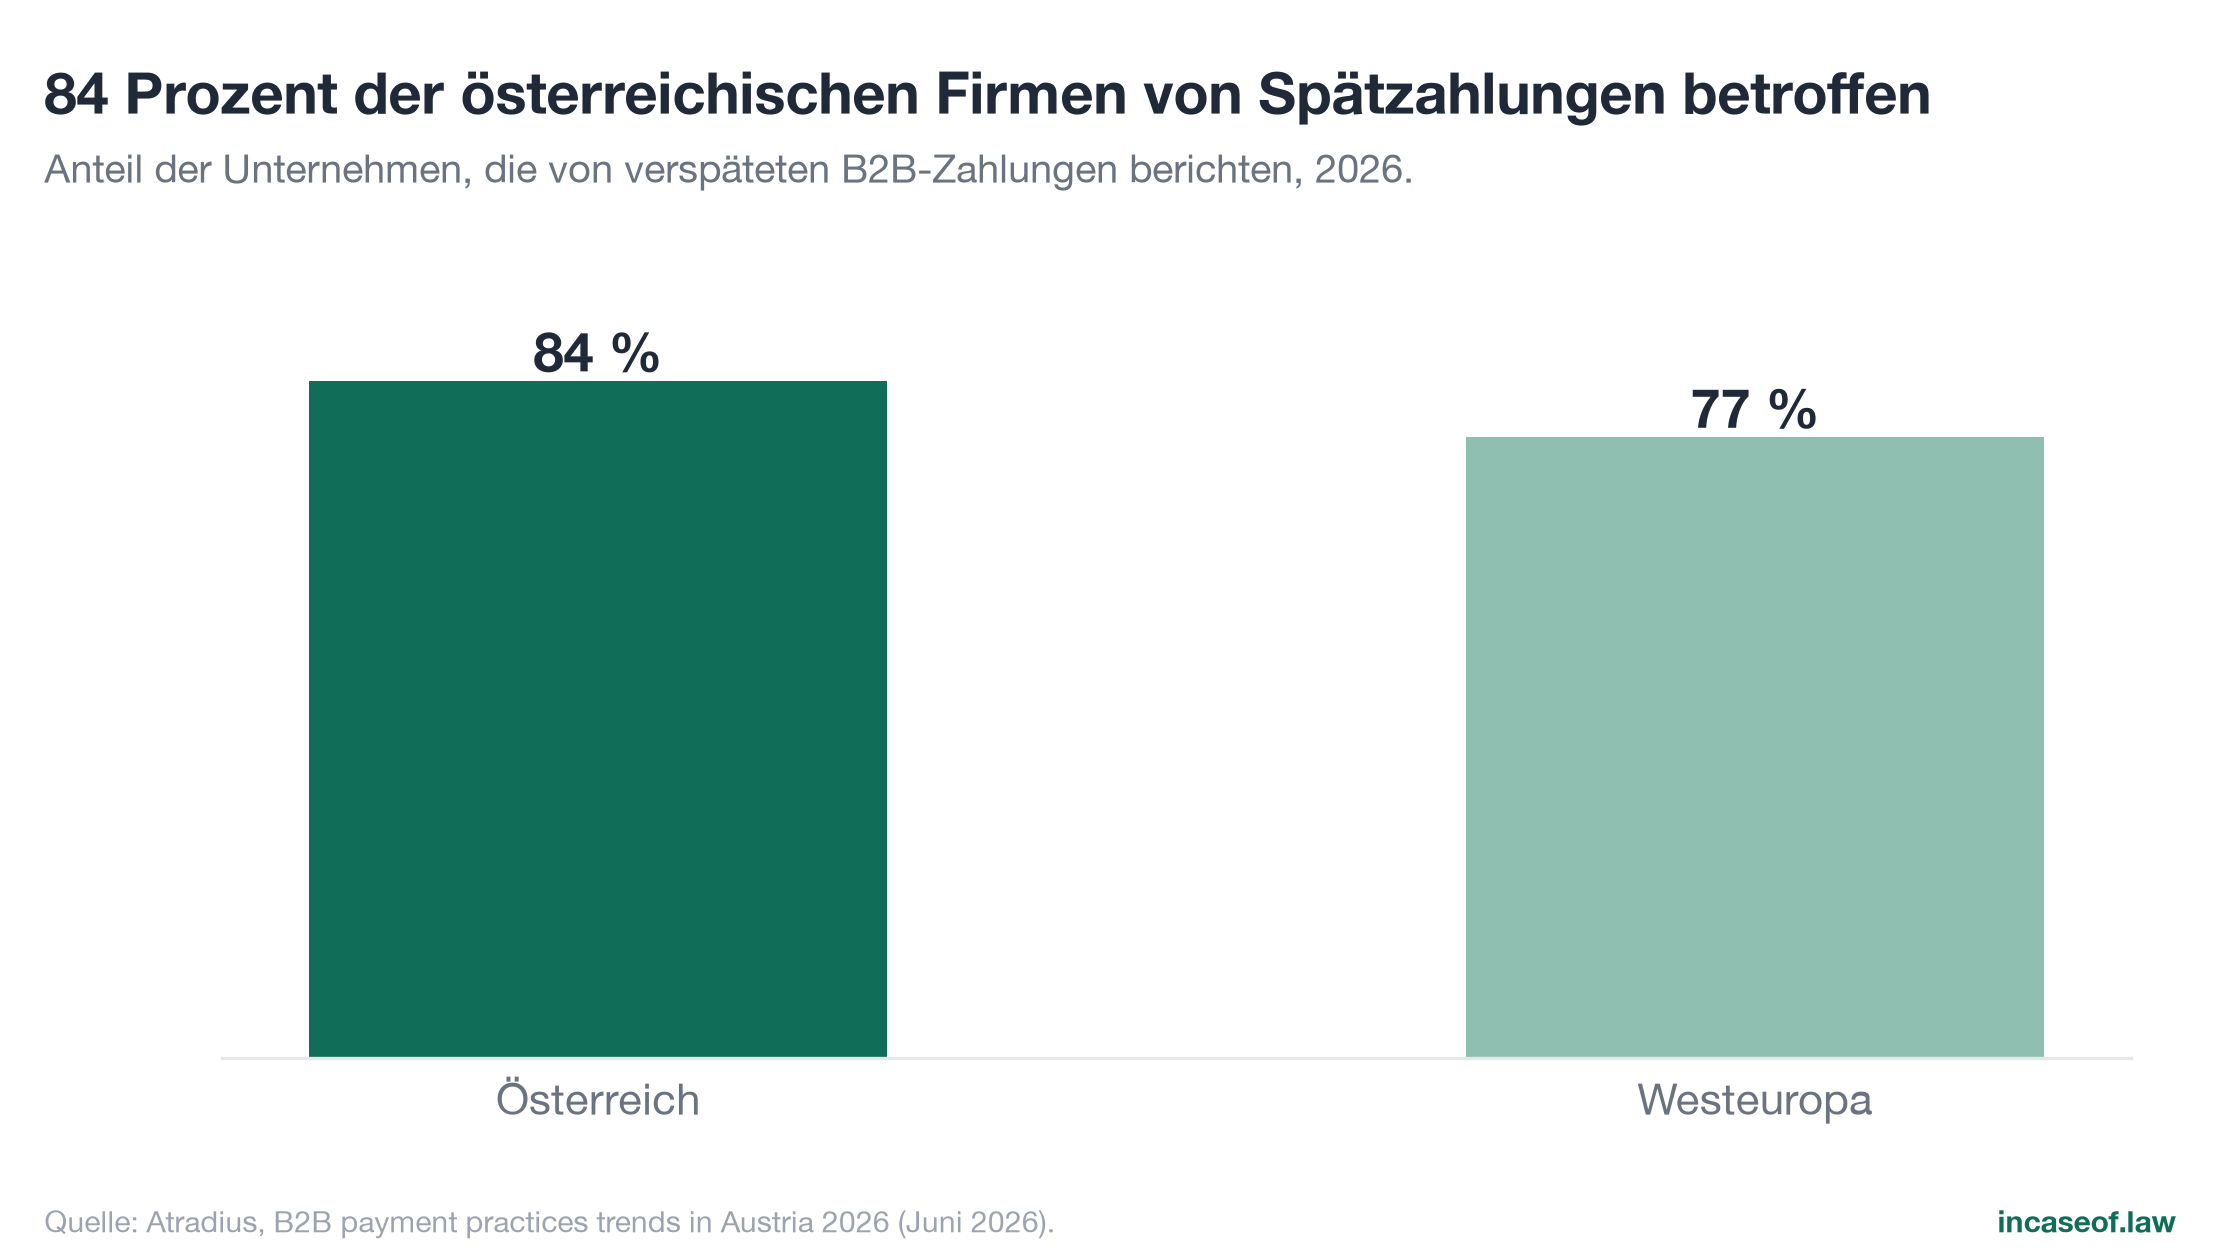
The consequences are measurable: around 2 percent of B2B revenue of Austrian companies is written off as uncollectible, and 54 percent of respondents name their customers' liquidity problems as the most frequent reason for late payment (Atradius, 2026). Late payment is therefore predominantly an expression of real liquidity shortage along the chain, not mere negligence.
11.2 Creditor concerns: Austria at the top
For Austria, the European Payment Report paints a remarkably tense picture of sentiment: 63 percent of Austrian companies state that they worry more than ever about their customers' ability to pay, the highest value of all countries surveyed (Intrum, 2026b). 32 percent report losses of production or productivity because resources go into collecting overdue receivables, more than twice the European average of 15 percent (Intrum, 2026b). 52 percent fear a further rise in their customers' default risk; only 2 percent consider no protective measures necessary at all (Intrum, 2026b).
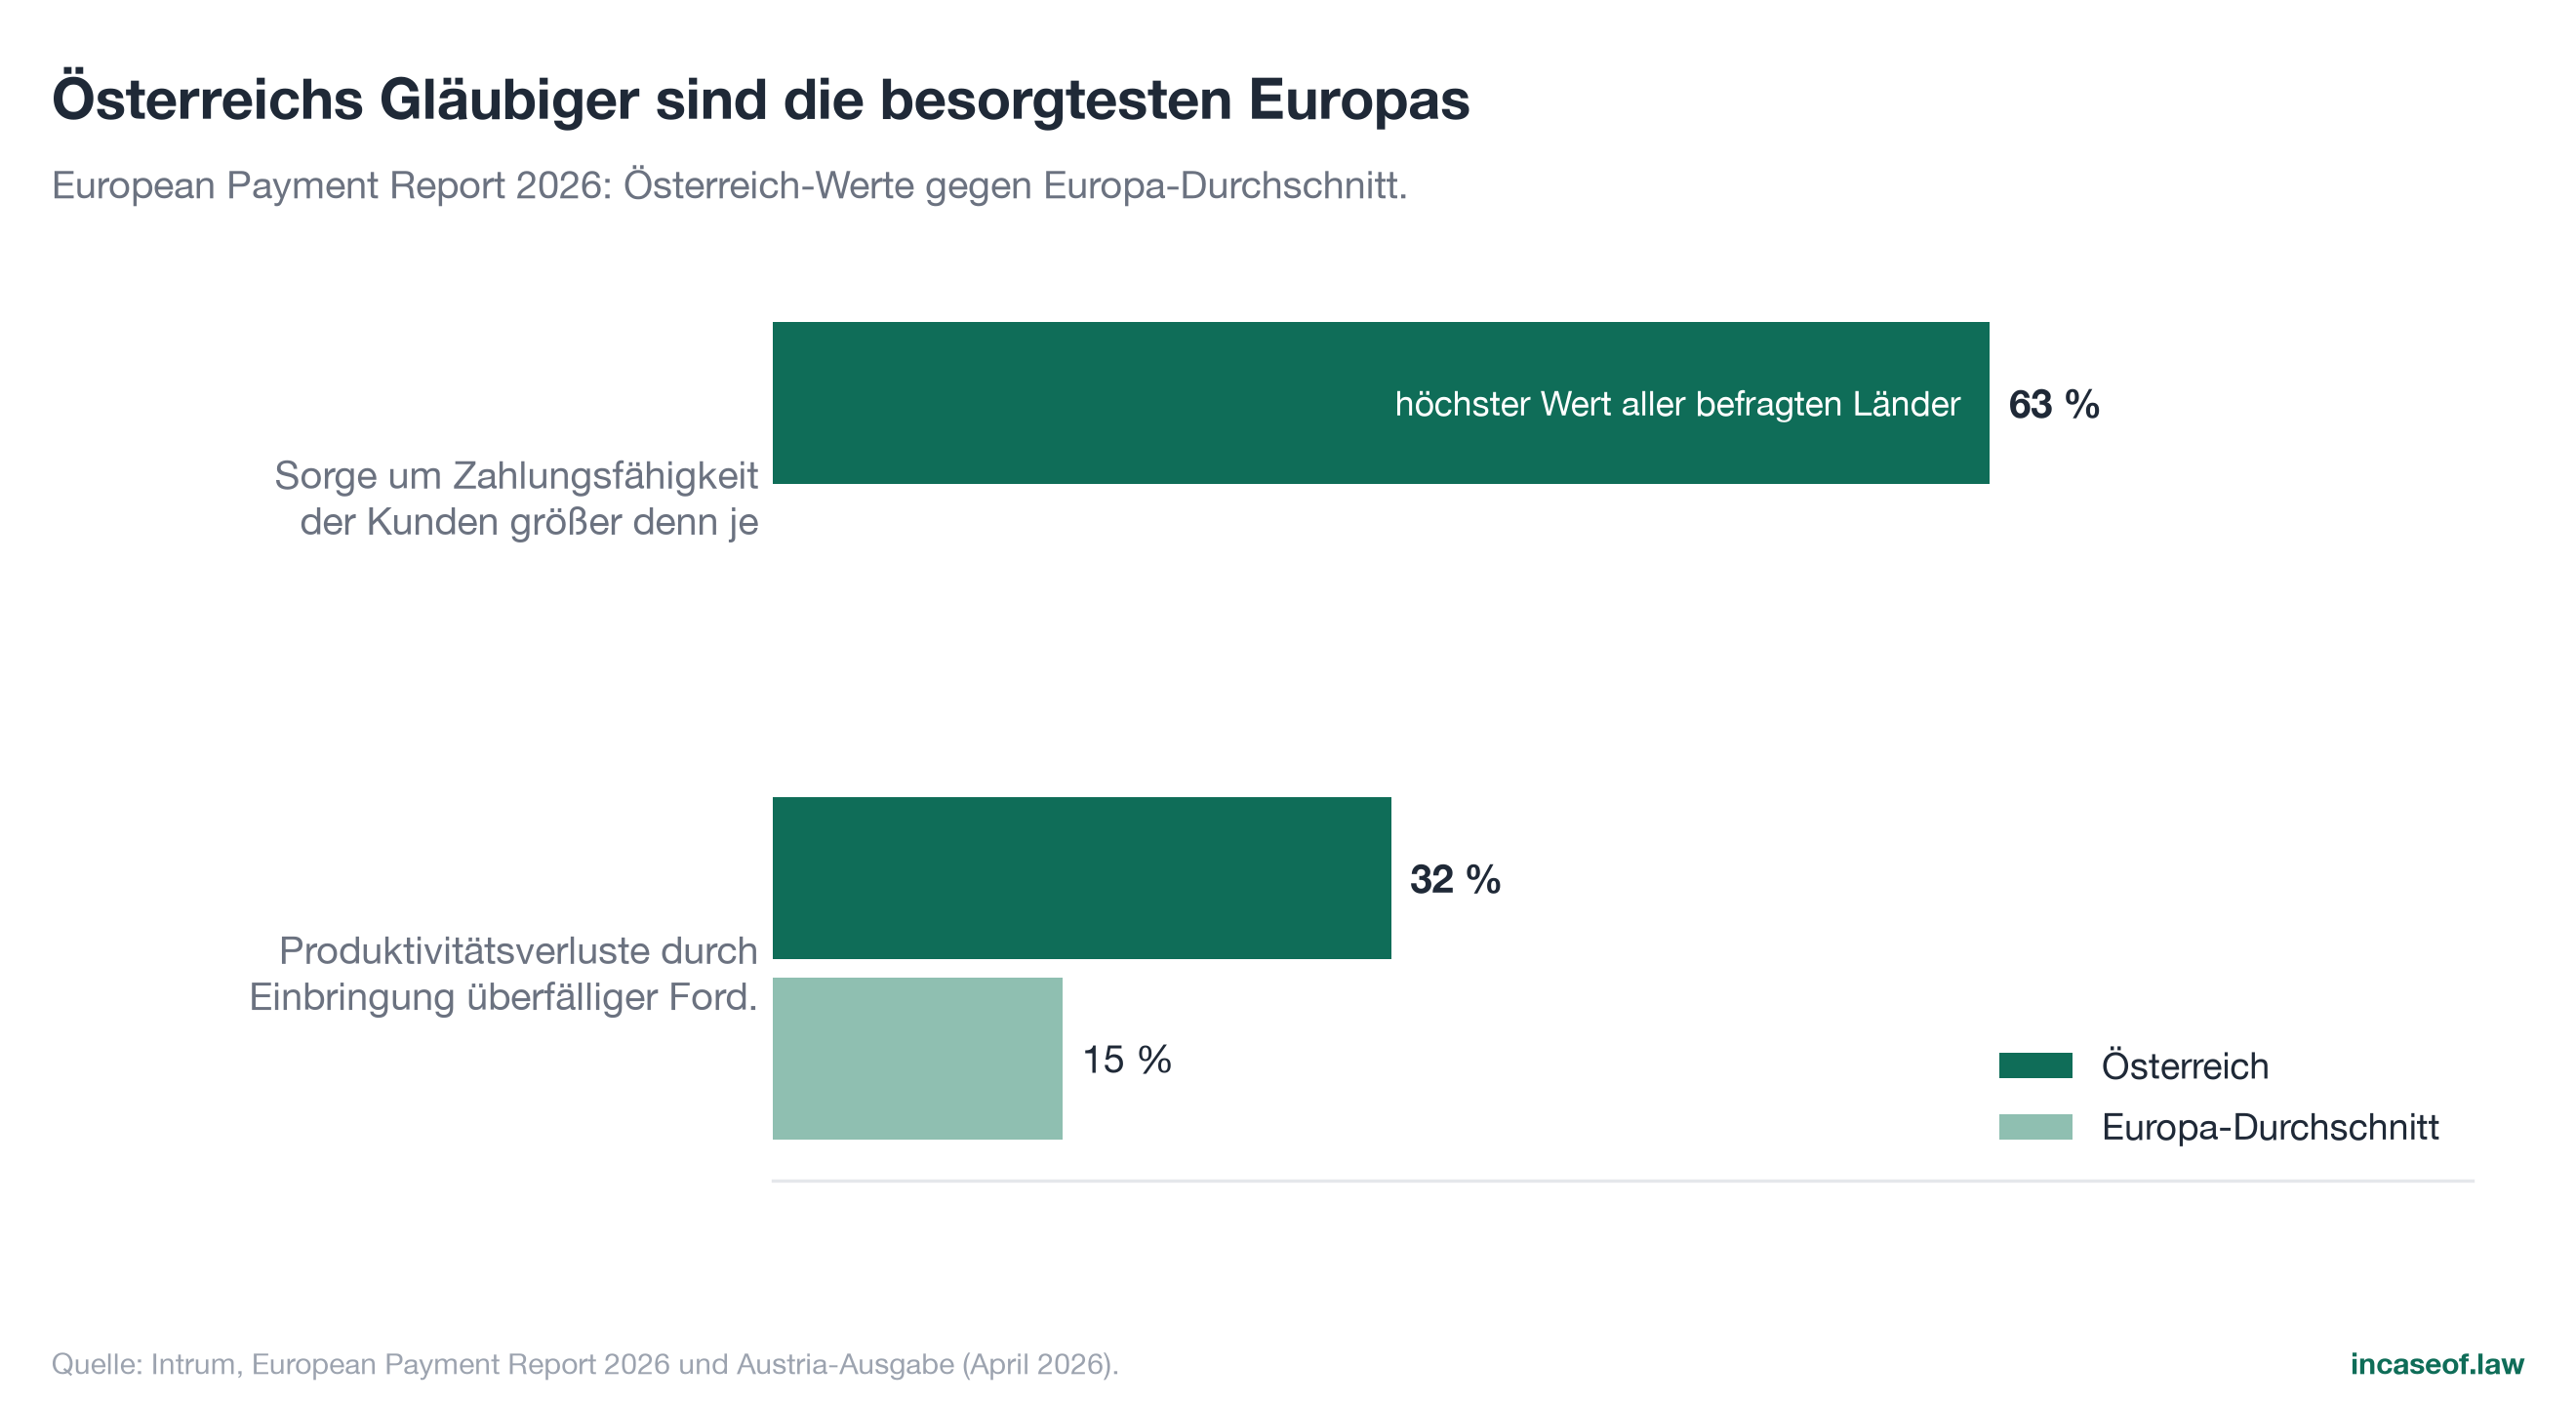
Across Europe, the burden has crossed a symbolic threshold: companies record an average of 12.13 percent of revenue paid late, but consider only 12.08 percent sustainable; the actual figure therefore exceeds the self-defined limit of what is bearable for the first time (Intrum, 2026a). And the domino effect is expressly documented: 62 percent of European companies state that they themselves pay their suppliers later because of late customer payments (Intrum, 2026a). Late payment propagates; that is exactly why the population of doubly exposed companies described in Chapter 8 is systemically relevant.
11.3 Response patterns: insurance instead of process
The difference in counter-strategies is revealing. According to Atradius (2026), Austrian companies rely more heavily on credit insurance, value adjustments and formal enforcement, while Western European companies more frequently turn to active credit management, process automation and customer diversification. Austria insures and writes off where others steer. On the state of digitalisation, Intrum (2026a) reports across Europe that 66 percent of companies already use artificial intelligence in payment management, that 34 percent do not use it at all, and that 55 percent believe they lack the capabilities to realise its potential. For a country with the highest measured creditor concern and twice the European average of productivity losses, this is the largest untilled field: the modernisation of the receivables process itself.
11.4 The insolvency environment in comparison
The European insolvency picture (Chapter 4.2) rounds this off: with 197,610 corporate insolvencies in Western Europe, 2025 reached the highest level in more than twenty years; Austria was in the midfield with plus 4.3 percent (Creditreform, 2026). Austria is therefore not an outlier, but a particularly tense specimen of a pan-European pattern: a high insolvency burden, growing stocks of receivables, and limits of what is bearable in the payment flow that are increasingly being exceeded.
12. Sector perspective: where the pressure is greatest
An important limit up front: the register data used in this study contain no structured sector identifier (ÖNACE); a robust sector ranking of receivables ratios from the balance sheet data itself is therefore not possible and is deliberately not claimed here (Chapter 14). The sector perspective consequently rests exclusively on external, verified secondary sources, and it is confined to those sectors for which robust figures are available.
12.1 Trade: the largest insolvency block
Trade leads the Austrian insolvency statistics: 1,192 insolvency cases in 2025, more than in any other sector (KSV1870, 2026a). At the same time, Atradius (2026) reports that payment delays affecting 20 to 40 percent of B2B invoices occur more frequently in Austria than in the Western European average, and locates this clustering "mainly in trade". The combination of tight margins, weak consumer demand and a high density of invoices makes the sector doubly vulnerable: as a debtor in the insolvency statistics and as a creditor exposed to late payment.
12.2 Construction: structurally vulnerable
Construction follows immediately behind, with 1,080 insolvency cases in 2025 (KSV1870, 2026a). Its pre-existing burden is documented cyclically: real value added in the sector fell by 4.2 percent in 2024, the second consecutive year of recession (WIFO, 2026). Atradius (2026) attests a "structural vulnerability" to Austrian construction and names construction and services as the main drivers of the insolvency outlook for 2026; longer payment terms are said to be widespread among SMEs in construction in particular. The sector's risk profile is the classic one for a receivables study: project-shaped work, acceptance and inspection processes, disputes over variations, high advance performance, tight margins.
12.3 Services: receivables as the most important asset
Among business services the situation is more heterogeneous, but no more relaxed. Creditreform (2026) reports an increase of 8.7 percent in service provider insolvencies in Western Europe in 2025; Atradius (2026) counts the sector among the main drivers of Austrian insolvency activity. Economically this is plausible: services are labour-intensive, cannot be stored and are often tied to release and acceptance processes; at the same time there is no realisable collateral for bank financing. For many service providers, receivables are the most important asset, and precisely for that reason the central risk.
12.4 Transport and logistics: deliberately without a ranking figure
For transport and logistics, no sufficiently robust, source-backed figures on receivables terms or outstanding ratios are available for Austria in 2026. The study therefore refrains from any numerical classification of this sector. This restraint is method: a study that claims to substantiate every figure names gaps instead of filling them with pseudo-precision.
12.5 Consequence for the interpretation of the register data
The secondary evidence supports the distribution findings of Chapters 5 to 9: the sectors with the highest insolvency and late payment pressure (trade, construction, services) are at the same time sectors with structurally high stocks of receivables and thin buffers. The group of doubly exposed companies identified in Chapter 8 (negative equity, receivables ratio above 50 percent) is likely to be over-represented in these sectors; that will only become verifiable once sector identifiers can be linked with balance sheet data, a clearly named next step for research (Chapter 15).
13. Consequences and options for action
13.1 Liquidity chains and domino effects
The empirical findings add up to a mechanism. First: 194.9 billion euros of corporate assets depend on the ability of third parties to pay (Chapter 5). Second: a fifth of entities have no equity buffer, and 9,139 combine missing buffers with a dominant receivables burden (Chapter 8). Third: a third of companies could not replace even ten percent of their receivables out of their own cash (Chapter 9). Fourth: 62 percent of European companies openly state that they pass late customer payments on to their own suppliers (Intrum, 2026a). This is the anatomy of a domino effect: one party's delay is the next party's withdrawal of financing. KSV1870 (2025) describes the same mechanism from the insolvency side as a "pull effect" with the risk of follow-on insolvencies; the European Commission puts the share of late payment in EU corporate insolvencies at around a quarter (European Commission, 2022).
Against this background, the central thesis of this study is deliberately soberly worded: not every high receivables ratio is risky. It becomes risky where it meets weak buffers, restrictive financing and elevated insolvency activity. In 2026, all three conditions are met simultaneously in Austria.
Business research has long supported this reading. Deloof (2003) showed on Belgian companies that shorter receivables and inventory periods go along with higher profitability. Baños-Caballero, García-Teruel and Martínez-Solano demonstrated an inverted U-shaped relationship between working capital and corporate performance for Spanish SMEs (2012) and British companies (2014): a certain level of tied-up current assets is productive, too much of it lowers profitability and firm value, especially at financially constrained firms. On this evidence, the heavily populated upper edge of the Austrian distribution (a quarter of companies above a 56 percent receivables ratio) operates in a zone in which additional capital commitment no longer creates any added benefit.
13.2 What tied-up capital costs
Capital commitment has a quantifiable price, even without a single default. At a cost of capital of 4 percent, the stock of 194.9 billion euros causes annual financing or opportunity costs of around 7.8 billion euros; at 5 percent it is 9.7 billion, at 6 percent 11.7 billion, at 8 percent 15.6 billion euros (Figure 16). This scenario calculation is neither a damage estimate nor a macroeconomic credit cost statistic; it merely translates the order of magnitude of the commitment into annual costs. The range is realistic in any case: the statutory default interest rate of 10.73 percent (WKO, 2026a) marks what the legislator itself regards as an appropriate price for late money, and lies above the entire scenario range.
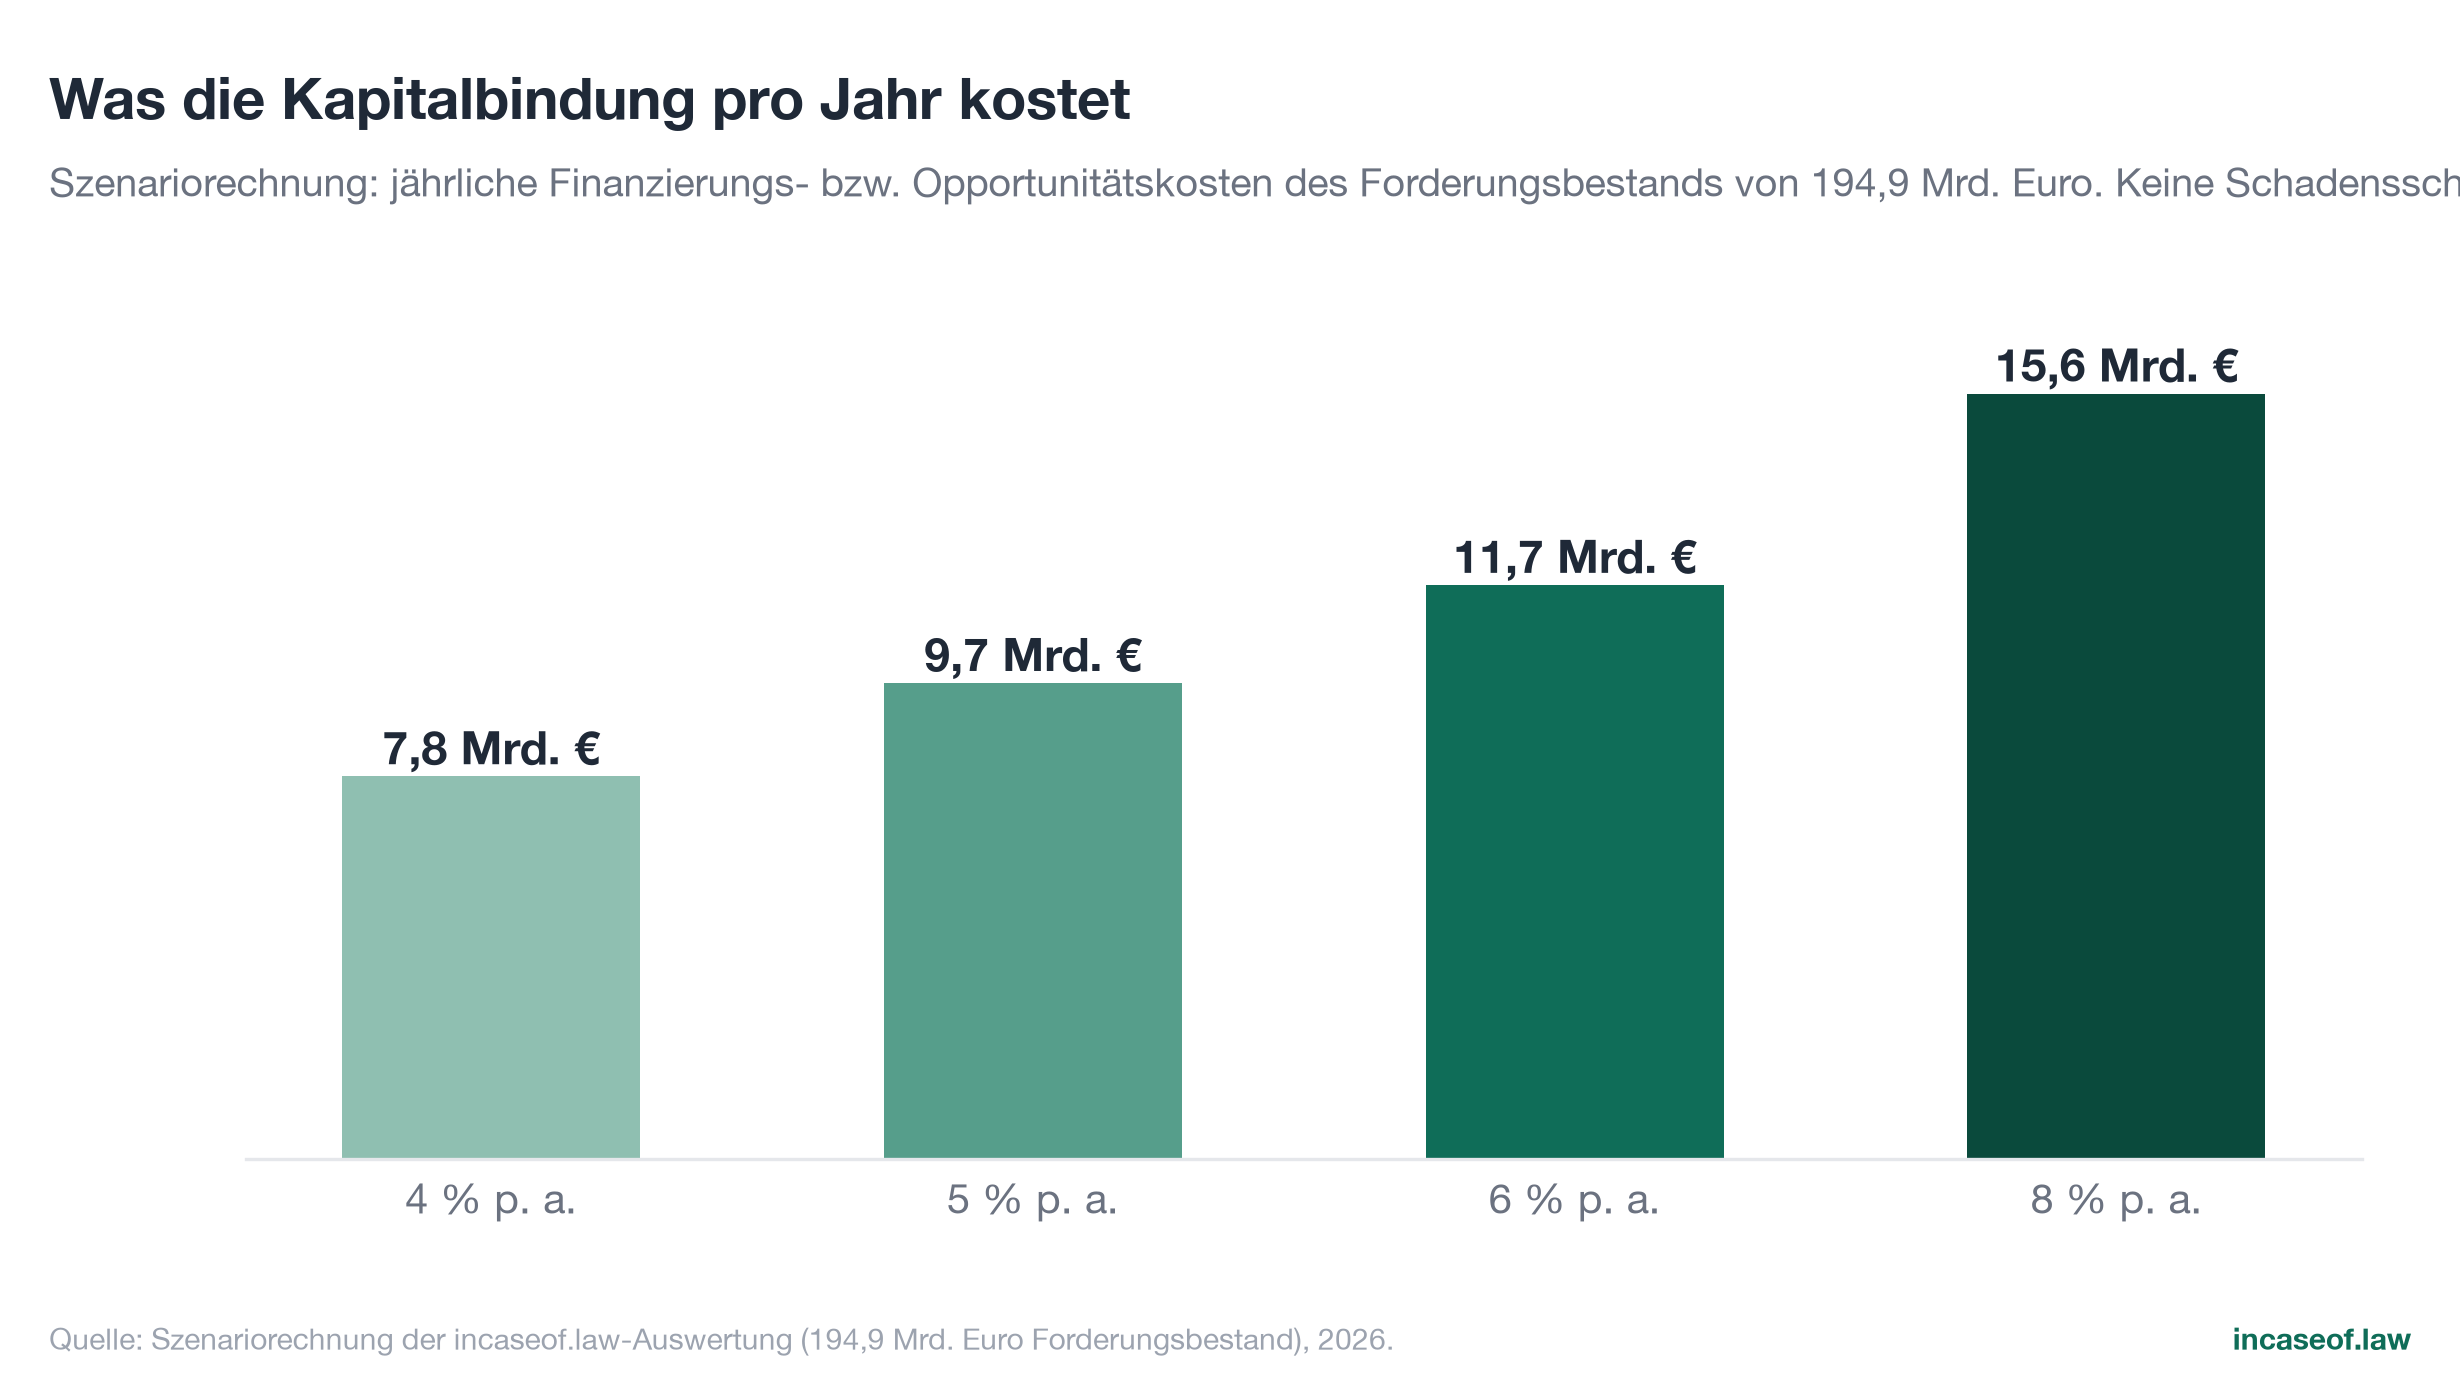
To this come the documented real costs of collection: 32 percent of Austrian companies report productivity losses from chasing overdue receivables (Intrum, 2026b), and around 2 percent of B2B revenue is written off as uncollectible (Atradius, 2026).
13.3 Options for action without a product recommendation
The data lead to an order of priorities that starts before any individual instrument. This study deliberately recommends no product and no provider; it names the levers that follow from the findings and the legal position.
First: credit policy before delivery. The legal framework permits clear payment terms (up to 60 days permissible in any event, Section 459 UGB), default interest of currently 10.73 percent and the 40 euro flat rate; a reminder is not a precondition for filing suit (WKO, 2026a). Anyone who takes credit checks, limits and due dates seriously only once payment is late shifts the problem into the most expensive phase.
Second: process quality and monitoring. The difference between Austria (focus on insurance) and Western Europe (focus on process) in counter-strategies (Atradius, 2026) marks the largest room for improvement: shorter time to invoicing, systematic monitoring of due dates, segmented escalation stages. The concentration findings of this study supply the prioritisation logic: a few large positions determine the volume, many small ones the breadth; both need different routines.
Third: digitalisation of receivables processes. Across Europe, 66 percent of companies use AI in payment management, but 55 percent say they lack the capabilities (Intrum, 2026a). Automated invoicing and reminder runs are not optional extras in 2026, they are the precondition for reducing the productivity losses of collection (Austria: 32 percent affected).
Fourth: buffers and structure. The 9,139 doubly exposed entities (Chapter 8) show where receivables management alone is not enough: without building equity, every payment disruption remains a threat to existence. Conversely, the 34.7 percent with full cash coverage (Chapter 9) show that comfortable buffers are achievable in this corporate landscape too.
Fifth: consistent, legally sound escalation. Factoring and debt collection perform different functions along the life cycle of a receivable: factoring monetises current, undisputed receivables earlier; debt collection addresses due and non-performing positions within a regulated framework (a regulated trade, cost caps through the maximum rates ordinance; Chapter 3.3). Neither instrument replaces sound credit policy and processes; both are downstream building blocks of a chain whose order is fixed: prevention first, then monitoring, then escalation, and lastly risk transfer or collection.
13.4 The economic policy dimension
For economic policy, the finding carries two messages. First, the pending EU regulation proposal on late payment (COM(2023) 533) is not a marginal topic: in an economy whose disclosing sector ties up 38 percent of GDP in receivables, more binding payment deadlines are a liquidity programme that costs not a cent of budget. Second, the transparency infrastructure itself is having an effect: only electronic disclosure and the opening of register data as high-value datasets (Implementing Regulation (EU) 2023/138) make a comprehensive, independent measurement like this one possible. Open data here is early risk detection for the economy, directly.
14. Limitations
The value of a register-based full survey stands or falls with honesty about its limits. The following restrictions are to be read alongside any use of the study's results.
1. Item B.II is an aggregate. "Receivables and other assets" covers trade receivables, receivables from affiliated companies (including cash pooling and intra-group settlement), tax credits, deposits and loans granted. Only large entities disclose the breakdown. The 194.9 billion euros are tied-up capital, not the sum of open customer invoices, and certainly not of overdue invoices. Statements such as "X owes Y" cannot be derived from these data.
2. Reporting date values. 86.1 percent of the accounts represent 31 December. Stocks of receivables fluctuate seasonally, by project and through accounting policy; the study measures a year-end snapshot, not annual averages.
3. No earnings data for the breadth. Small entities and micro entities do not disclose a profit and loss account; revenue is available for only 5,362 entities (3.6 percent). Turnover indicators such as DSO can therefore not be calculated for the mass of companies, and the profit and loss sub-sample is selected by size.
4. No sector allocation. The filing formats analysed contain no structured ÖNACE identifier. All sector statements in this study come from external sources and are marked as such.
5. Temporal mix of reporting dates. The population mixes balance sheet dates from early 2024 to mid-2026 (87.4 percent from 2024, 12.5 percent from 2025). The aggregates describe the most recent available position per company, not a uniform calendar day.
6. Data quality of individual fields. 5.8 percent of entities carry no size class information; the legal form is populated in structured form only in the new data format and was therefore not analysed. In the older format, prior-year values inflated by a factor of 1,000 occur in isolated cases; aggregate year-on-year comparisons therefore use the documented plausibility rule, while medians are unaffected. 651 sets of accounts (0.4 percent) were excluded from ratio calculations under fixed rules.
7. The remaining term note is a sub-sample. The disclosure under Section 225(3) UGB is available only for 2,001 entities filing early in the new format and is selected by filing date; the study therefore refrains from extrapolating the volume. In substance: the remaining term is the time until the amount falls due, not the age of the receivable; the note measures planned long-term commitment, not late payment.
8. The disclosing sector is not the whole economy. Sole traders (around 76 percent of all businesses according to the WKO membership statistics), typical partnerships and members of the liberal professions do not disclose balance sheets. It is precisely the classic small-claim clientele that is invisible here. The economy as a whole therefore ties up more capital in receivables than this study reports; the 194.9 billion euros are a lower bound for the measurable sector.
9. Delimitation from macroeconomic statistics. The OeNB financial accounts report trade credit of around 64.7 billion euros for non-financial corporations (Q1 2026; OeNB, 2026c). The difference from the B.II sum is explained by the broader balance sheet definition (intra-group positions, other assets) and is intended; the two figures answer different questions (Chapter 2.5). Anyone wishing to look exclusively at classic trade receivables should use the OeNB figure.
10. No causal statements. The study describes stocks, distributions and correlations; it permits no statements about the causes of individual balance sheet constellations and no credit judgements about individual companies. Naming individual entities has been avoided throughout.
15. Conclusion and outlook
This study has measured the receivables landscape of Austrian limited companies as a register-based full survey for the first time. The result can be summed up in one sentence: in 2026, tied-up capital is a macroeconomic quantity with microeconomic explosive force.
Macroeconomic, because 194.9 billion euros, 38 percent of GDP and a fifth of the aggregate balance sheet total, sit in promises to pay rather than in available liquidity, three times more than the entire cash holdings of the same companies. Microeconomic, because behind the aggregates lies an extreme inequality: one percent of companies holds 61 percent of the stock, while tens of thousands of small entities carry stocks that are existential relative to their buffers. 21.6 percent of entities report negative equity, 9,139 combine it with a receivables-dominated balance sheet, and a third of all companies could not replace even ten percent of their receivables out of their own cash.
This picture of the stock meets an environment that makes mistakes more expensive: historically high insolvency numbers with 39 percent of proceedings closed for lack of assets, key interest rates rising again, more restrictive lending and payment behaviour in which Austria shows the highest measured creditor concern in Europe. The days when stocks of receivables were an interest-free buffer in current assets are over.
At the same time, the study urges precision. Item B.II measures tied-up capital, not overdue invoices; its peak values also reflect group financing and holding structures; and the disclosing sector is not the whole economy. Anyone working with these figures, in the media, in politics or in company management, should cite the distributions, not only the sums, and should carry the limitations along. The robustness of the statements rests precisely on the fact that this study estimates nothing it cannot measure.
The outlook is concrete. Three developments will redraw the receivables landscape of the coming years: first, the format changeover to JAb 4.0, which makes the remaining term note machine-readable across the board and thereby makes planned long-term commitment observable in breadth for the first time; the sub-sample analysed here (11.9 percent of companies with a disclosure, 12.3 percent of the volume) is the prelude. Second, the possible EU Late Payment Regulation, which would shift the landscape of deadlines in B2B business. Third, the annual continuation of this survey itself: with every disclosure year, the snapshot becomes a time series that makes visible the build-up and reduction of tied-up capital, the migration between the risk cells and the effect of the interest rate environment. The data basis for that is public, the methodology disclosed, the continuation announced.
17. Citation note and data availability
Canonical citation
For the study as a whole:
incaseof.law (2026). Waiting for the money. The receivables landscape of Austrian companies 2026. Analysis of n = 149,916 annual accounts from the Austrian commercial register. Vienna: incaseof.law.
Citation by person (APA):
Kindler, M., & Holzbach, S. (2026). Waiting for the money. The receivables landscape of Austrian companies 2026. Vienna: incaseof.law.
Short form for media and running text:
incaseof.law study "Waiting for the money" (2026), analysis of 149,916 annual accounts from the Austrian commercial register.
For individual key figures, naming the figure, the year and the source is recommended, for example: "194.9 billion euros of receivables held by Austrian limited companies (incaseof.law, 2026)".
Data basis and re-use
The source of the register data is the Republic of Austria, represented by the Federal Ministry of Justice (commercial register, retrieved through the IWG interface of JustizOnline, data as of 17 July 2026). All aggregations, key figures and charts are the publisher's own calculations and enrichments; they are marked as such relative to the raw register data. The study does not pass on raw data of individual entities and names no individual companies.
The key figures of the study (result tables in CSV format) and the full analysis code are available from the publisher on request and are documented in the appendix. Charts from the study may be used for editorial purposes if the source line is named ("Source: incaseof.law analysis of 149,916 annual accounts (commercial register, Republic of Austria/Federal Ministry of Justice), 2026").
Contact
incaseof.law GmbH, Vienna. Press and data enquiries: see the press contact on incaseof.law.
List of sources
All online sources were retrieved on 17 July 2026 and checked in substance against the statements cited. Date of retrieval in the following: 17 July 2026, unless stated otherwise.
Primary data
incaseof.law. (2026). Waiting for the money. The receivables landscape of Austrian companies 2026 [own analysis of n = 149,916 annual accounts; register data source: Republic of Austria, represented by the Federal Ministry of Justice, commercial register/JustizOnline, IWG interface; data as of 17 July 2026]. Vienna: incaseof.law.
Republic of Austria, represented by the Federal Ministry of Justice. (2026). Commercial register, electronically disclosed annual accounts [register data, retrieved through the IWG interface of JustizOnline]. https://justizonline.gv.at/jop/web/iwg (terms of use: https://justizonline.gv.at/jop/web/iwg/terms)
Studies, statistics and market reports
Atradius. (2026, 5 June). B2B payment practices trends in Austria 2026 (Payment Practices Barometer, Austrian edition). https://group.atradius.com/knowledge-and-research/reports/b2b-payment-practices-trends-in-austria-2026 (PDF: https://group.atradius.com/dam/jcr:0dcab286-dbcb-4717-8210-c40120880572/payment-practices-barometer-western-europe-2026-austria-en-fin.pdf)
Creditreform Wirtschaftsforschung. (2026, 5 May). Corporate insolvencies in Europe, year 2025. https://www.creditreform.de/aktuelles-wissen/pressemeldungen-fachbeitraege/news-details/show/unternehmensinsolvenzen-in-europa-jahr-2025 (prior-year values as first published in the 2023 and 2024 annual reports; individual annual values are revised by Creditreform after publication.)
European Central Bank. (2026, 28 April). The euro area bank lending survey, First quarter of 2026. https://www.ecb.europa.eu/press/pr/date/2026/html/ecb.pr260428~6b156107c1.en.html
Intrum. (2026a, April). European Payment Report 2026. https://www.intrum.com/insights/publications/epr-2026/ (PDF: https://www.intrum.com/media/ymyjm5fm/intrum_epr-2026.pdf)
Intrum. (2026b, April). Austria: European Payment Report 2026 (Austrian country edition). https://www.intrum.at/business-losungen/reports-insights/reports/austria-european-payment-report-2026/ (PDF: https://www.intrum.at/media/up2idtec/2026-intrum-austria-epr.pdf)
KSV1870. (2025, 13 January). Insolvency trend 2024. Insolvency surge with a pull effect: company failures rise by 22 percent. https://www.ksv.at/insolvenzstatistik/insolvenzentwicklung-2024 (press release: https://www.ksv.at/pressemeldungen/insolvenzschub-sogwirkung-firmenpleiten-steigen-22-prozent)
KSV1870. (2026a, 13 January). Corporate insolvency 2025. Corporate insolvencies continue to rise: 19 cases per day. https://www.ksv.at/insolvenzstatistik/unternehmensinsolvenz-2025
KSV1870. (2026b, 16 July). Corporate insolvencies, first half of 2026. https://www.ksv.at/insolvenzstatistik/unternehmensinsolvenzen-1-halbjahr-2026
Oesterreichische Nationalbank. (2026a, 11 June). ECB: monetary policy decisions of 11 June 2026 (key interest rates with effect from 17 June 2026). https://www.oenb.at/Presse/oenb-aktuell/20260611-ezb-geldpolitische-beschluesse.html
Oesterreichische Nationalbank. (2026b). Reference interest rates (history of the base rate). oenb.at, reference interest rates, base rate history
Oesterreichische Nationalbank. (2026c, 7 July). Financial accounts: financial interlinkages of non-financial corporations (standardised table 801.1.1, trade credit). https://www.oenb.at/Statistik/Standardisierte-Tabellen/gesamtwirtschaftliche-finanzierungsrechnung/volkswirtschaftliche-sektoren/nichtfinanzielle-unternehmen.html
Statistik Austria. (2026, 5 March). Economic output grew by 0.6% in 2025 (press release 129-048/26; nominal GDP 2025: 512.8 billion euros). https://www.statistik.at/fileadmin/announcement/2026/03/20260305BIP2025Q4.pdf
WIFO. (2026, June). Economic forecast June 2026 (WIFO/IHS forecasts at a glance 2/2026, published by the WKO, department for economic policy). https://www.wko.at/oe/news/konjunkturprognose-wifo-ihs-2-2026.pdf
Austrian Federal Economic Chamber (WKO). (2024). Construction in recession in 2024 as well (sector focus construction, data basis WIFO). https://www.wko.at/oe/news/branchenfokus-bau
Austrian Federal Economic Chamber (WKO). (2025). Transmission of balance sheets to the commercial register through JustizOnline from 1 January 2026. https://www.wko.at/information-consulting/unternehmensberatung-buchhaltung-informationstechnologie/buchhaltung/uebermittlung-der-bilanzen-an-das-firmenbuch-fina
Austrian Federal Economic Chamber (WKO). (2026a). Late payment by a business partner. https://www.wko.at/vertragsrecht/zahlungsverzug-des-geschaeftspartners
Austrian Federal Economic Chamber (WKO). (2026b, February). Chamber members by legal form 2025 (statistical yearbook). https://www.wko.at/statistik/jahrbuch/mg-rf.pdf
Legal sources
Austrian Commercial Code (UGB): Sections 221, 222, 224, 225, 242, 277, 278, 283, 456, 458, 459 UGB, consolidated federal law. Legal Information System of the Republic of Austria (RIS). https://www.ris.bka.gv.at/GeltendeFassung.wxe?Abfrage=Bundesnormen&Gesetzesnummer=10001702
UGB Threshold Values Ordinance, Federal Law Gazette II No. 318/2024. https://ris.bka.gv.at/Dokumente/BgblAuth/BGBLA_2024_II_318/BGBLA_2024_II_318.html
Trade Act 1994 (GewO 1994): Section 94(36), Section 118 GewO (debt collection institutes), consolidated federal law. RIS. https://www.ris.bka.gv.at/GeltendeFassung.wxe?Abfrage=Bundesnormen&Gesetzesnummer=10007517
Ordinance on the maximum remuneration rates payable to debt collection institutes, Federal Law Gazette No. 141/1996. RIS. https://www.ris.bka.gv.at/GeltendeFassung.wxe?Abfrage=Bundesnormen&Gesetzesnummer=10007798
Act on the Re-use of Public Sector Information 2022 (IWG 2022), Federal Law Gazette I No. 116/2022, in particular Sections 8 and 14. RIS. https://www.ris.bka.gv.at/GeltendeFassung.wxe?Abfrage=Bundesnormen&Gesetzesnummer=20011973
European Union. (2011). Directive 2011/7/EU of the European Parliament and of the Council of 16 February 2011 on combating late payment in commercial transactions (recast). EUR-Lex. https://eur-lex.europa.eu/legal-content/EN/TXT/?uri=CELEX:32011L0007
European Commission. (2022, 21 December). Implementing Regulation (EU) 2023/138 laying down a list of specific high-value datasets and the arrangements for their publication and re-use (annex, category "companies and company ownership"). EUR-Lex. https://eur-lex.europa.eu/legal-content/EN/TXT/?uri=CELEX:32023R0138
European Commission. (2023). Proposal for a Regulation on combating late payment in commercial transactions, COM(2023) 533 final (procedure 2023/0323(COD)). Procedural status: European Parliament, Legislative Observatory. https://oeil.secure.europarl.europa.eu/oeil/en/procedure-file?reference=2023/0323(COD)
von der Leyen, U. (2022, 14 September). 2022 State of the Union Address by President von der Leyen (SPEECH/22/5493). European Commission. https://ec.europa.eu/commission/presscorner/detail/en/speech_22_5493
Federal Ministry of Justice. (2026). IWG terms of use for the re-use of information (JustizOnline, point 1.3: source attribution "Republic of Austria, represented by the Federal Ministry of Justice"). https://justizonline.gv.at/jop/web/iwg/terms
Academic literature
Baños-Caballero, S., García-Teruel, P. J., & Martínez-Solano, P. (2012). How does working capital management affect the profitability of Spanish SMEs? Small Business Economics, 39(2), 517-529. https://doi.org/10.1007/s11187-011-9317-8
Baños-Caballero, S., García-Teruel, P. J., & Martínez-Solano, P. (2014). Working capital management, corporate performance, and financial constraints. Journal of Business Research, 67(3), 332-338. https://doi.org/10.1016/j.jbusres.2013.01.016
Deloof, M. (2003). Does working capital management affect profitability of Belgian firms? Journal of Business Finance & Accounting, 30(3-4), 573-588. https://doi.org/10.1111/1468-5957.00008
Appendix
A. Reproducibility
All key figures in this study come from the analysis script analyse/analyse.py (Python, pandas), which processes the raw database in read-only mode. The charts are produced by analyse/make_charts.py (primary data) and analyse/make_charts_extern.py (verified secondary data). The complete key figures are held in analyse/ergebnisse.json, the result tables as CSV in the folder analyse/.
Base filter of the study population: parse_ok = 1, most recent set of accounts per commercial register number, balance sheet date from 1 January 2024; n = 149,916.
B. Percentiles of the receivables ratio (as a percentage of total assets)
| Segment | P10 | P25 | Median | P75 | P90 | P95 | P99 | n |
|---|---|---|---|---|---|---|---|---|
| All | 0.5 | 5.0 | 22.5 | 56.2 | 89.1 | 98.5 | 100.0 | 149,265 |
| Micro | 0.3 | 3.4 | 21.2 | 61.0 | 93.5 | 99.7 | 100.0 | 84,450 |
| Small | 1.1 | 7.2 | 23.4 | 51.0 | 80.1 | 93.6 | 100.0 | 51,765 |
| Medium-sized | 5.7 | 12.6 | 25.8 | 46.9 | 73.1 | 86.1 | 98.2 | 3,359 |
| Large | 7.7 | 14.4 | 27.1 | 48.8 | 73.7 | 87.6 | 98.3 | 1,117 |
| Not stated | 0.5 | 5.3 | 23.2 | 58.0 | 90.3 | 99.3 | 100.0 | 8,574 |
C. Distribution of the receivables ratio
| Ratio class | Companies | Share of companies % | Volume bn € | Share of volume % |
|---|---|---|---|---|
| 0-10% | 50,810 | 34.0 | 13.02 | 6.7 |
| 10-20% | 19,731 | 13.2 | 23.96 | 12.3 |
| 20-30% | 14,796 | 9.9 | 24.08 | 12.4 |
| 30-40% | 11,751 | 7.9 | 22.28 | 11.4 |
| 40-50% | 9,635 | 6.5 | 18.90 | 9.7 |
| 50-60% | 8,153 | 5.5 | 18.93 | 9.7 |
| 60-80% | 13,752 | 9.2 | 24.68 | 12.7 |
| 80-101% | 20,637 | 13.8 | 49.01 | 25.2 |
D. Key figures by size class (Section 221 UGB)
| Segment | Companies | Median ratio % | Mean ratio % | Receiv. bn € | Equity negative % | Cash < 25% % | Median YoY % | Median stock € |
|---|---|---|---|---|---|---|---|---|
| All | 149,916 | 22.5 | 33.4 | 194.90 | 21.6 | 45.1 | 1.9 | 77,875 |
| Micro | 84,926 | 21.3 | 34.2 | 23.70 | 27.9 | 45.3 | 2.4 | 33,218 |
| Small | 51,869 | 23.4 | 32.1 | 69.10 | 13.0 | 44.1 | 1.4 | 253,676 |
| Medium-sized | 3,361 | 25.8 | 32.7 | 24.95 | 3.2 | 45.7 | -0.9 | 3,243,832 |
| Large | 1,117 | 27.1 | 34.0 | 52.80 | 2.0 | 58.1 | 1.4 | 18,320,180 |
| Not stated | 8,643 | 23.2 | 34.3 | 24.35 | 21.8 | 46.8 | 2.2 | 69,969 |
E. Concentration of the stock of receivables
| Group | Companies | Entry threshold € | Volume bn € | Share % |
|---|---|---|---|---|
| Top 0.1% | 150 | 146,091,990 | 65.39 | 33.6 |
| Top 1% | 1,499 | 16,528,464 | 118.84 | 61.0 |
| Top 5% | 7,496 | 2,950,269 | 157.70 | 80.9 |
| Top 10% | 14,992 | 1,257,932 | 171.97 | 88.2 |
Gini coefficient: 0.92. Companies with stocks from 1m € upwards: 17,983 (90.0% of the volume); from 100,000 € upwards: 68,484 (98.9%).
F. Cross-tabulation equity ratio x receivables ratio (companies)
| Equity ratio | Receiv. below 10% | 10-25% | 25-50% | above 50% |
|---|---|---|---|---|
| negative | 13,170 | 4,884 | 4,859 | 9,139 |
| 0-10% | 5,463 | 2,160 | 1,783 | 2,788 |
| 10-30% | 6,598 | 4,017 | 4,143 | 5,415 |
| above 30% | 25,579 | 16,524 | 17,543 | 25,200 |
G. Liquidity coverage (cash as a percentage of the stock of receivables)
| Coverage class | Companies | Share % |
|---|---|---|
| below 10% | 49,833 | 34.8 |
| 10-25% | 14,623 | 10.2 |
| 25-50% | 13,773 | 9.6 |
| 50-100% | 15,355 | 10.7 |
| 100% and above | 49,719 | 34.7 |
H. Balance sheet dates by quarter
| Quarter | Companies | Share % | Median ratio % | Volume bn € |
|---|---|---|---|---|
| Q1 | 14,369 | 9.6 | 23.2 | 21.26 |
| Q2 | 2,756 | 1.8 | 19.5 | 3.86 |
| Q3 | 1,228 | 0.8 | 24.6 | 2.26 |
| Q4 | 131,563 | 87.8 | 22.4 | 167.52 |
I. Companies by absolute size of the stock of receivables
| Stock class | Companies | Share of companies % | Volume bn € | Share of volume % |
|---|---|---|---|---|
| 0 | 6,000 | 4.0 | 0.00 | 0.0 |
| up to 10,000 € | 28,105 | 18.8 | 0.09 | 0.0 |
| 10,000-100,000 € | 47,141 | 31.5 | 2.05 | 1.1 |
| 100,000 €-1m € | 50,489 | 33.7 | 17.44 | 8.9 |
| 1-10m € | 15,498 | 10.4 | 43.98 | 22.6 |
| above 10m € | 2,480 | 1.7 | 131.34 | 67.4 |
J. List of charts
File names are those of the chart files supplied with the study; the charts themselves carry German labels, which the caption of each figure explains in English.
- 01_gebundenes_kapital, receivables against liquid funds (PNG 300dpi + SVG)
- 02_verteilung_forderungsquote, distribution of the receivables ratio (PNG 300dpi + SVG)
- 03_median_vs_mittelwert, median against mean (PNG 300dpi + SVG)
- 04_quoten_groessenklassen, ratio ranges per size class (PNG 300dpi + SVG)
- 05_lorenzkurve, Lorenz curve (PNG 300dpi + SVG)
- 06_top_anteile, top shares (PNG 300dpi + SVG)
- 07_firmen_vs_volumen, share of companies against share of volume (PNG 300dpi + SVG)
- 08_bestand_groessenklassen, stock by size class (PNG 300dpi + SVG)
- 09_ek_forderungen_heatmap, heatmap of equity against receivables ratio (PNG 300dpi + SVG)
- 10_negatives_eigenkapital, negative equity per size class (PNG 300dpi + SVG)
- 11_liquiditaetsdeckung, liquidity coverage (PNG 300dpi + SVG)
- 12_kassadeckung_groessenklassen, cash coverage per size class (PNG 300dpi + SVG)
- 13_yoy_dynamik, year-on-year dynamics (PNG 300dpi + SVG)
- 14_bilanzstichtage, balance sheet dates (PNG 300dpi + SVG)
- 15_restlaufzeit, remaining term of more than one year (PNG 300dpi + SVG)
- 16_opportunitaetskosten, opportunity costs (PNG 300dpi + SVG)
- 17_atradius_verzug, late payment in Austria against Western Europe (PNG 300dpi + SVG)
- 18_intrum_indikatoren, Intrum indicators for Austria against Europe (PNG 300dpi + SVG)
- 19_insolvenzen, company insolvencies in Austria (PNG 300dpi + SVG)
- 20_zinsen, base rate and default interest rate (PNG 300dpi + SVG)
About the author
Dr Maximilian Kindler is the founder and managing director of incaseof.law GmbH, a licensed debt collection institute in Austria and Germany with a model confirmed by the OGH. Analysis and editing: incaseof.law; all key figures are reproducible through the published analysis code. Register data source: Republic of Austria, represented by the Federal Ministry of Justice.